


1. How can I see how many people visit my tourist site?
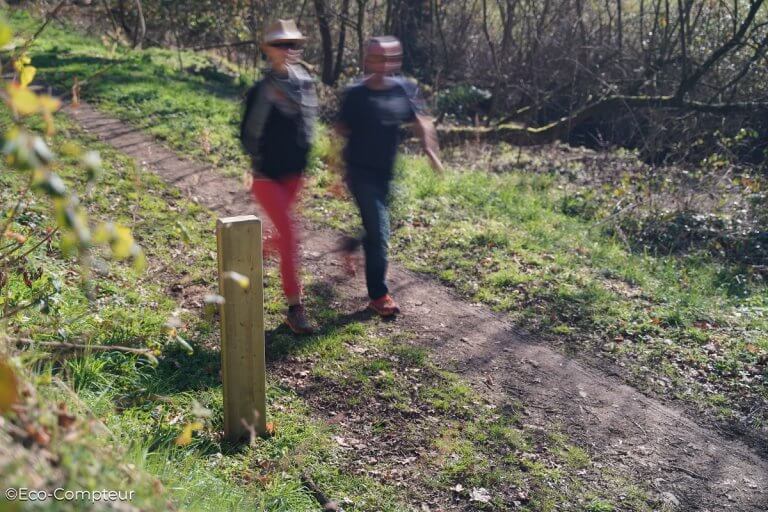
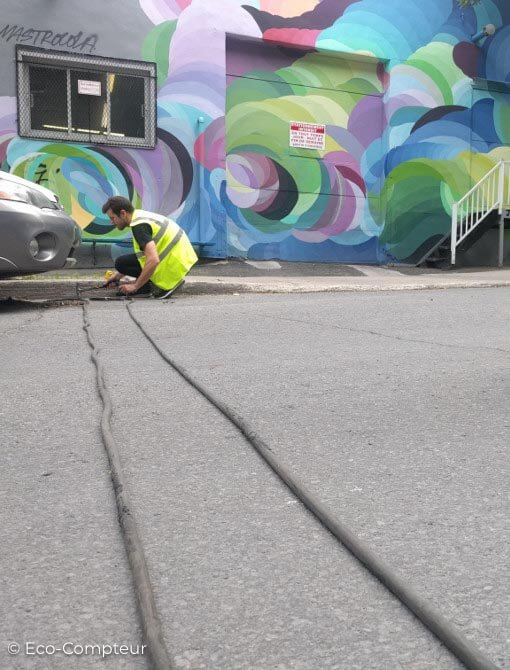
The easiest way to find out how many people visit a tourist site is to install one or more count systems directly on site, at the main entrances.
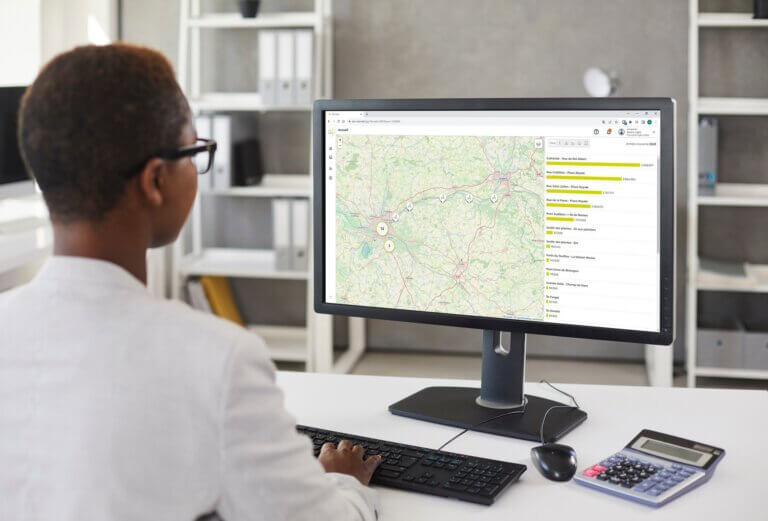
Measuring visitor numbers on the Lignon Gorges Himalayan Footbridge
The Lignon Gorges Footbridge is a magnificent footbridge in Auvergne, France, suspended above lush forests and the Lignon du Velay river.
As France’s longest Himalayan footbridge (268m), the Lignon Gorges footbridge is a unique tourist attraction. It offers a panoramic view of the biodiversity of a Natura 2000 site.
Two automated counters were installed at the entrances to the footbridge to measure the site’s appeal and understand its uses.

The data revealed the extent of the site’s popularity, with over 200,000 passages recorded in 2023! Peak use was observed in April, May, July and August.
The two counters also reveal a preference for access via the South footbridge (on the Grazac side), particularly in August: +44% more traffic! This is invaluable information when it comes to making decisions about future resources and developments.
Discover our new, compact PYRO Nano counter
 |
 |
 |
We have recently developed a new, compact, discreet, and cost-effective visitor counter for tourist sites: the PYRO Nano. Weatherproof and durable, it can detect users up to 4 meters away. It is also easy to install and discreet, as it can be installed on a trunk, post, or branch.

Communicating with mountaineers on Mont-Blanc
The protection of natural areas and the safety of users are also important considerations for tourism sites. To communicate effectively with users, count data are essential.
Using a PYRO counter (one of the highest of all our installed systems!), data is collected on the number of climbers using the Mont-Blanc acension trail. Visitor numbers are used to measure the level of exposure to risk, so that site managers can better communicate with climbers about the dangers of this access route.

Studies carried out by a scientific team have shown that a rock fall occurs on average every 24 minutes during critical periods (between 6pm and 8pm), and that the safest time to make the crossing is in the morning between 8am and 10am. Ultimately, the aim is to introduce an official bulletin warning of rockfalls, as is already done for avalanches.
According to mountain guide Hugues Chardonnet, the normal access route to Mont-Blanc is without doubt the most dangerous point in the Alps. Given that almost 20,000 climbers attempt to ascend the mountain every year, it is imperative to communicate better about the dangers. The data collected can be used to support research reports and communication campaigns.
2. How do you measure visitor numbers on a vast, open site?
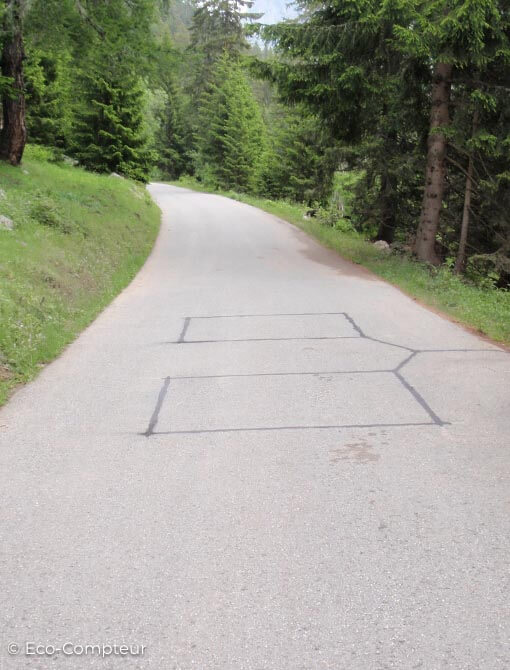
One of the challenges of measuring visitor numbers on a site is that, by definition, a permanent counter installed on site can only obtain data from a single location. This can limit the knowledge available when budget is a factor. There is, however, a way collecting visitor numbers on larger sites, using a combination of permanent and temporary counters.
We had the opportunity to do this for the Stenshuvud National Park in Sweden.

Mobile pedestrian counters were placed at four entrances, in addition to the permanent counting locations they already had, to ensure complete coverage of all the main access points to Stenshuvud. In total, there were two counting points at the north entrance, three at the main west entrance, and one counting point at the south entrance.
Temporary data were extrapolated from permanent data to provide a highly accurate estimate of annual visitor numbers at all entrances. On this basis, the total number of visitors for the full year (2022) was calculated: 246,000 tourists.
July was the busiest month, with 82,000 visitors.
Other lessons for park managers could be drawn from this report: the analysis showed that 7 out of 10 visitors accessed the park via the main entrance.
Unsurprisingly, weekend days were the busiest (18% of the total on Saturdays, 17% on Sundays).
This data helped guide park managers in communicating with the public, identifying the busiest days and months, and providing an indication of the variability of visitor numbers.

As shown above, attendance in the busiest month (July 2022) was 16 times higher than in the least frequented month (February 2022), which makes it possible to adapt resources. If problems of overcrowding are identified, specific communication campaigns can be carried out to smooth out visitor numbers over the year.
Learn more about the study here
3. How can I find out about my visitors’ journeys and profiles?
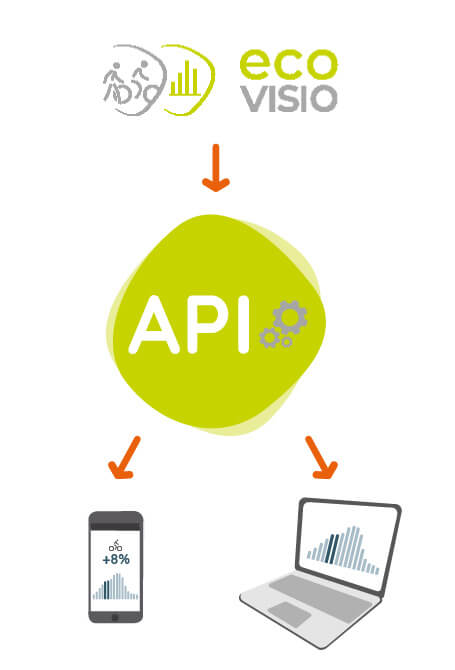
To take analysis a step further, we can also cross-reference different data sources to obtain information on visitor profiles (in a totally anonymous way, of course). This is what we now offer with our VisitorFlow solution.
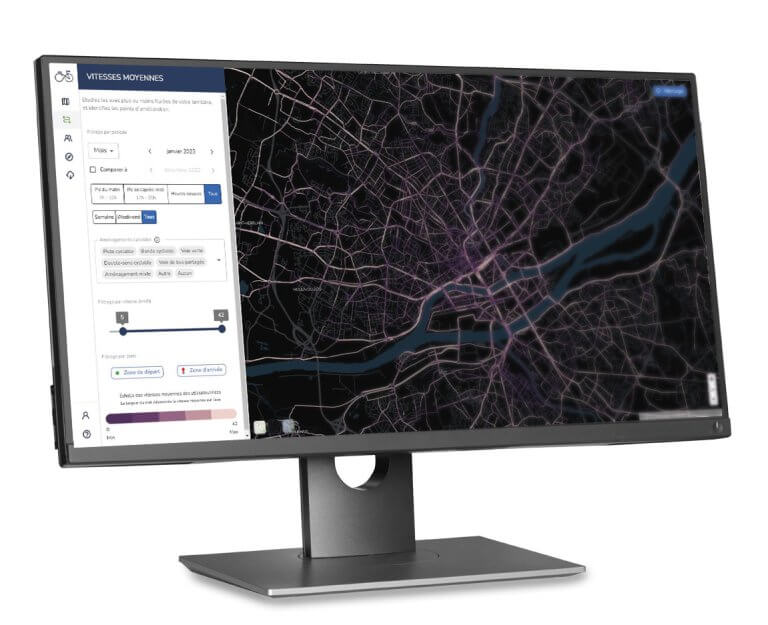
For large, open sites, this solution provides more precise information on visitor routes by combining count data with GPS or cell phone data.
Here’s an example from the Canigou site:

By differentiating between weekdays and weekends, we can better understand how the site is used, and adapt our communications accordingly.
La Torche site (29)
The La Torche site is a protected area in several respects (conservatoire du littoral, classified site, Ramsar…). A global study is underway to develop the site in a sustainable way, and the commune of Plomeur and the community of communes of the Pays Bigouden Sud (Finistère) are seeking to objectivize visitor numbers.
A test phase was carried out with the VisitorFlow solution, and here’s what Ingrid Lainé, project manager – Pointe de La Torche development study, had to say:
“This solution enabled us, over a one-month period, to understand the uses and behaviors of tourists and visitors, in particular: time spent on site, geographical origin, variation in visitor numbers according to sporting events and/or weather conditions, including swell, since we’re a surf spot! After a conclusive trial, we decided to launch a campaign over several months to obtain data according to seasons and events.”
For example, the study revealed an average visit duration of 58mn, and an average number of visits per person of 1.5.

This knowledge provides food for thought about the targeted communication campaigns that can be carried out.