Published on Jul 23, 2025
How to Win Park Grants and Funding with Count Data


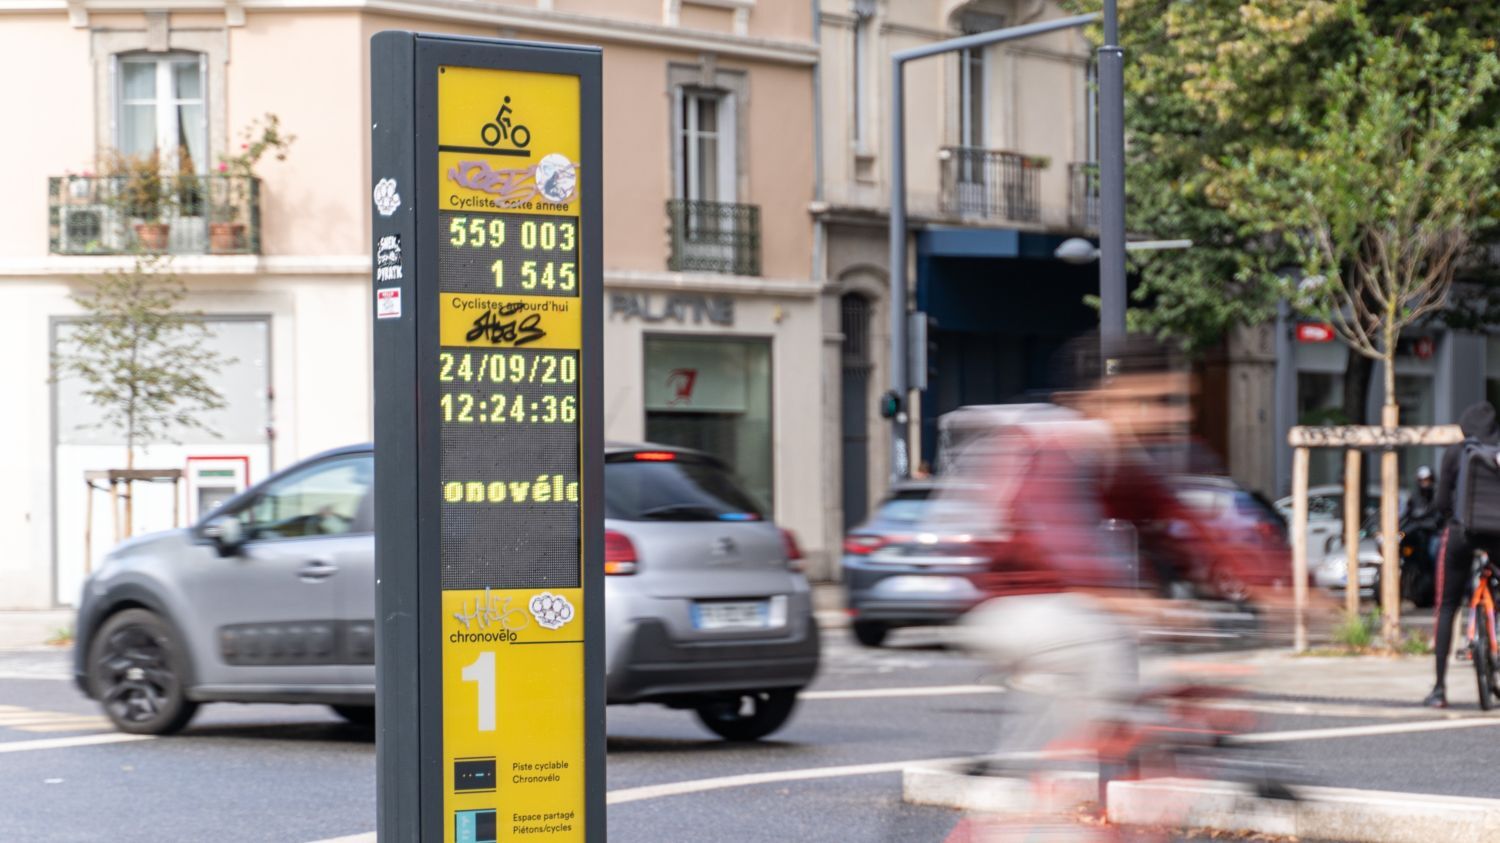
Eco-Counter index: analysis of bicycle traffic in the first half of 2025 (Europe)
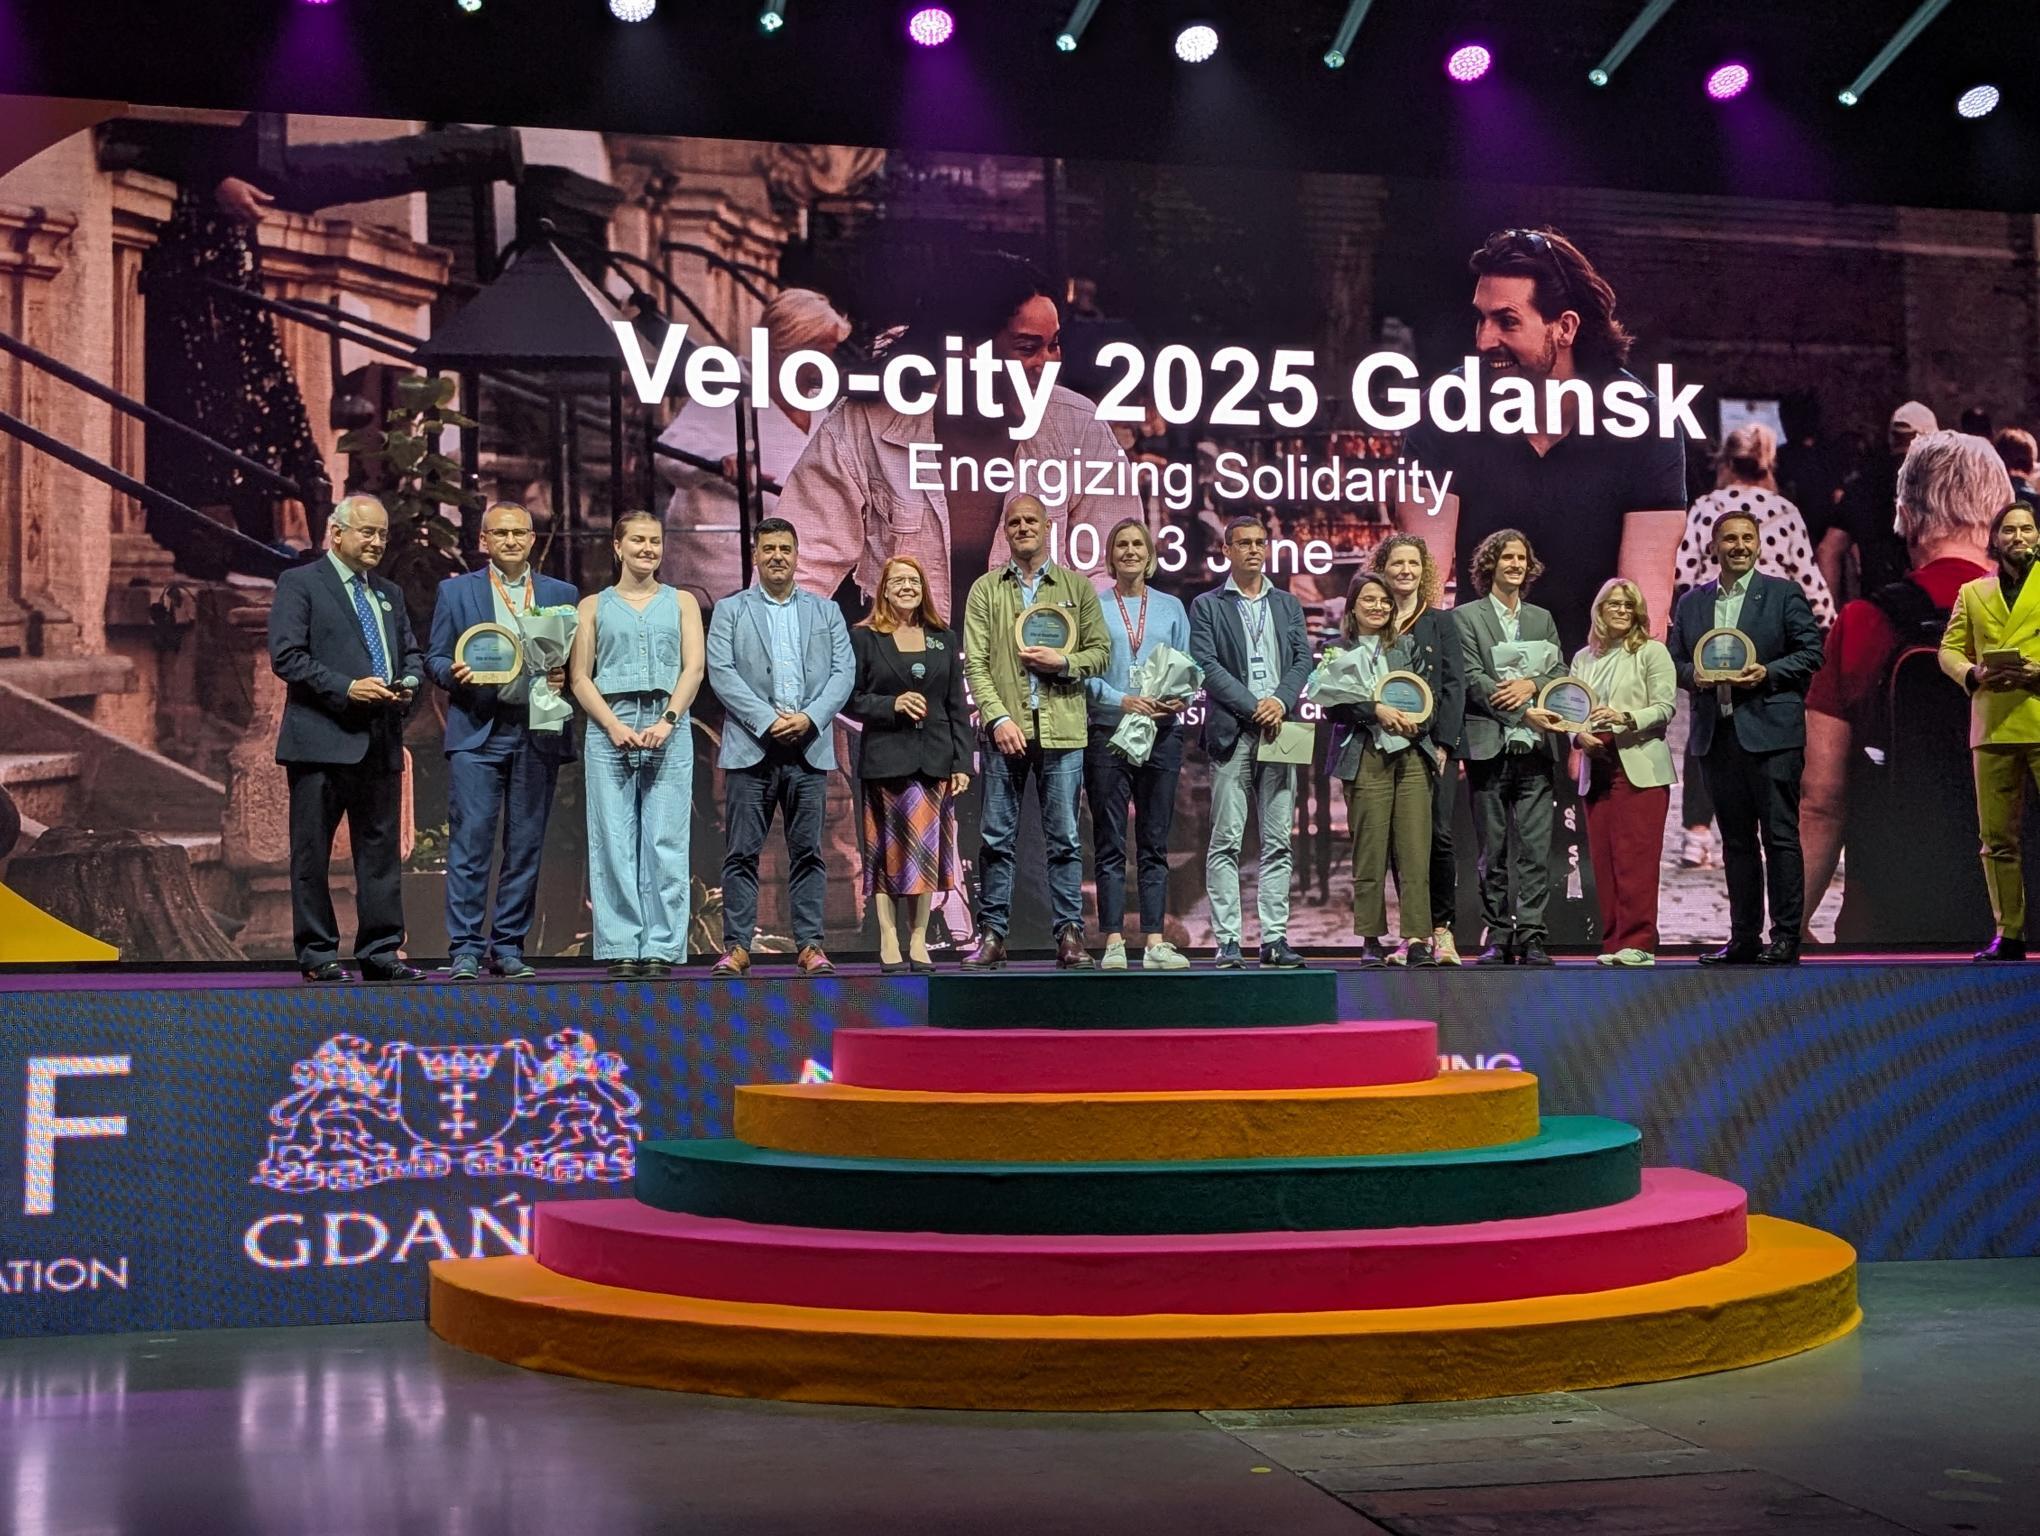
Velo-City 2025 Gdansk: our lookback!

How to measure walkability in your city
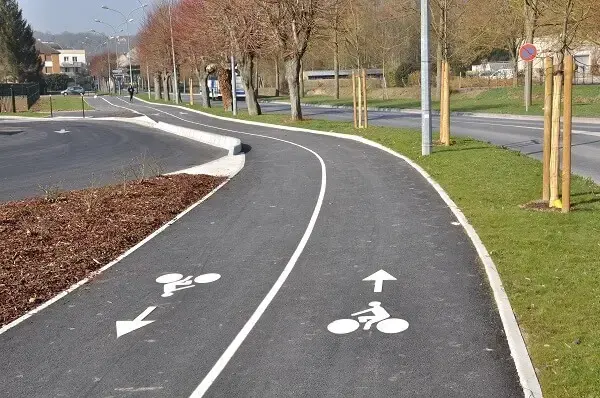
Finding the right size for pedestrian and bike infrastructures

Pedestrian and bicycle traffic analysis: discover Eco-Visio's latest features
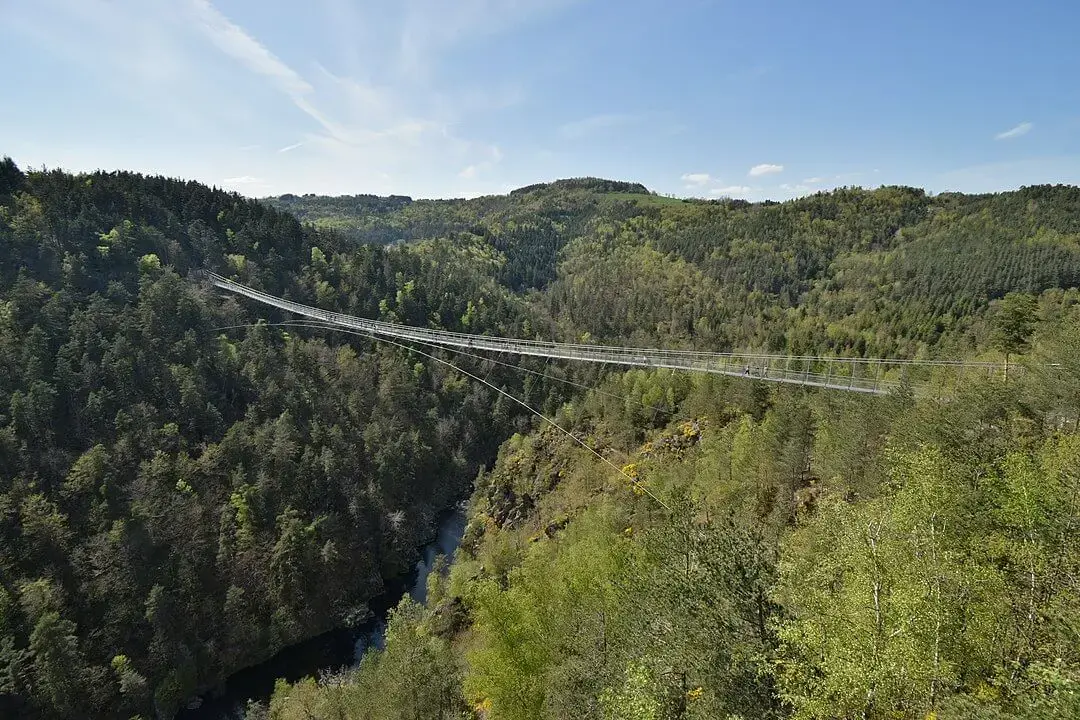
Visitor analysis at tourist sites: 5 examples from Europe
10 key ways to prepare for tourist season and measure economic impacts