- Home
- Developing active transportation
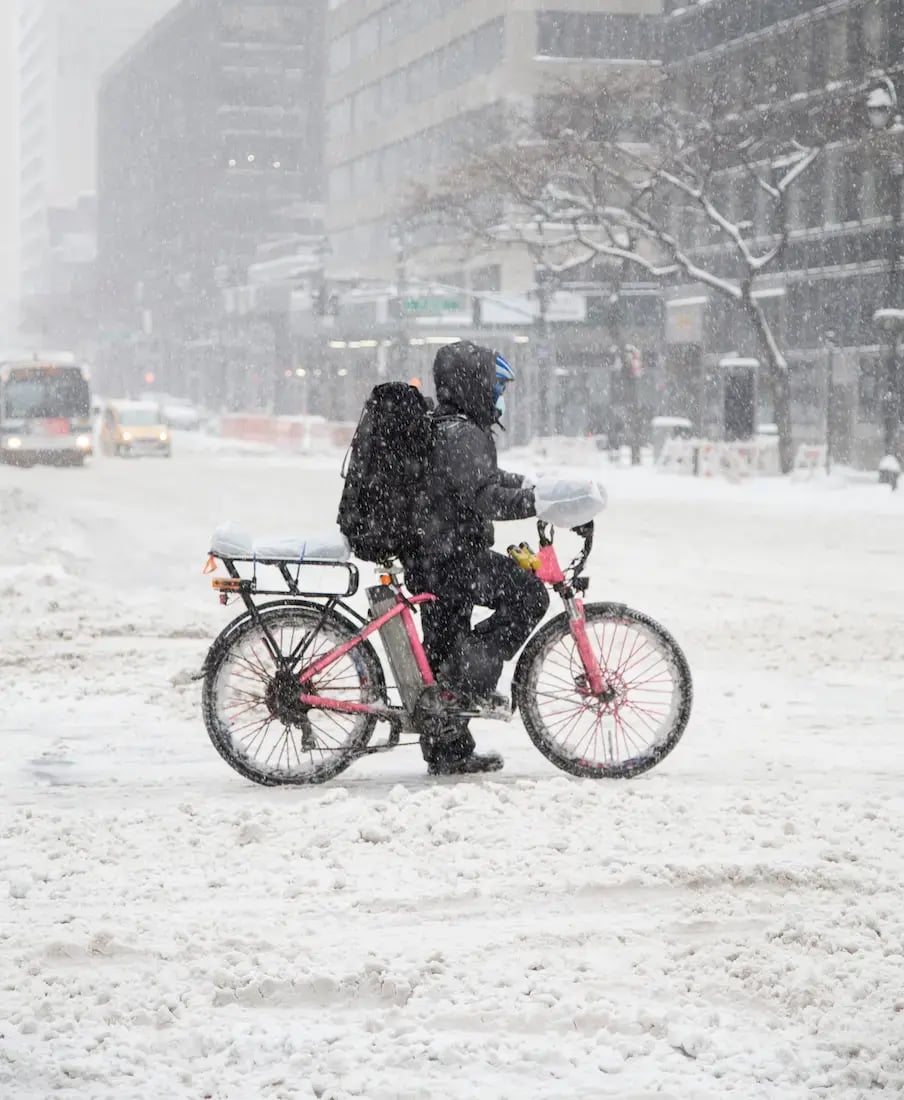
- Weather impacts on walking & cycling
Measuring Weather Impacts on Pedestrian and Bicycle Traffic
If you want to get the most out of your network, understanding the impact of weather on pedestrian and bicycle traffic is a huge asset.
Active mobility is heavily influenced by the weather, and citizens will make different transportation choices in different climates. Weather data can help you understand variations in transportation trends and figure out which weather factors are the most influential.
Most people have an idea of how weather might increase or decrease pedestrians and cyclists on a road - but data often reveals higher levels of winter cycling and walking in the rain than expected.

How does weather affect walking and cycling volumes?
Rain, wind or cold are often perceived as major obstacles to cycling and walking.
Even if these modes are more sensitive to weather conditions than motorists, the impact is usually less or different than expected.
For example, in a study we conducted with People for Bikes, we saw that winter cycling rates increased steadily over the last five years in the United States. One explanation could be that climate change is creating warmer winters, prompting many people to use active transportation in less than ideal weather. This data demonstrates the importance of collecting usage data in various weather conditions to properly maintain winter facilities and reduce risks to pedestrians and cyclists.
Common pitfalls of not collecting weather data

Weather can hide consistent growth patterns.
Instead of averaging the whole year, comparing days with similar weather conditions gives you more precise growth numbers.

A high or low month might not represent real behavior.
A sudden drop or increase in volume might be confusing until you realize you had an unusually rainy or hot period.

You might omit an important minority of users.
Pedestrian and bike volumes might drop in the winter, but many people still need facilities to be maintained year-round.
Key weather indicators for decision-making
Winter retention rate
A simple indicator to extract from count data is the winter retention rate. It is calculated by dividing the average number of visitors in winter months by the average number of visitors in summer months.
Depending on weather conditions and climate, winter retention can vary enormously. Calculating it, and then monitoring it on a regular basis, provides key trend information, especially for cities that have drastically changing seasons.
In Montreal, a study showed that the winter retention rate rose from 8% in 2016 to 14% in 2020, emphasizing the city's need to continue clearing snow from bikes lanes in the winter for these winter cyclists.

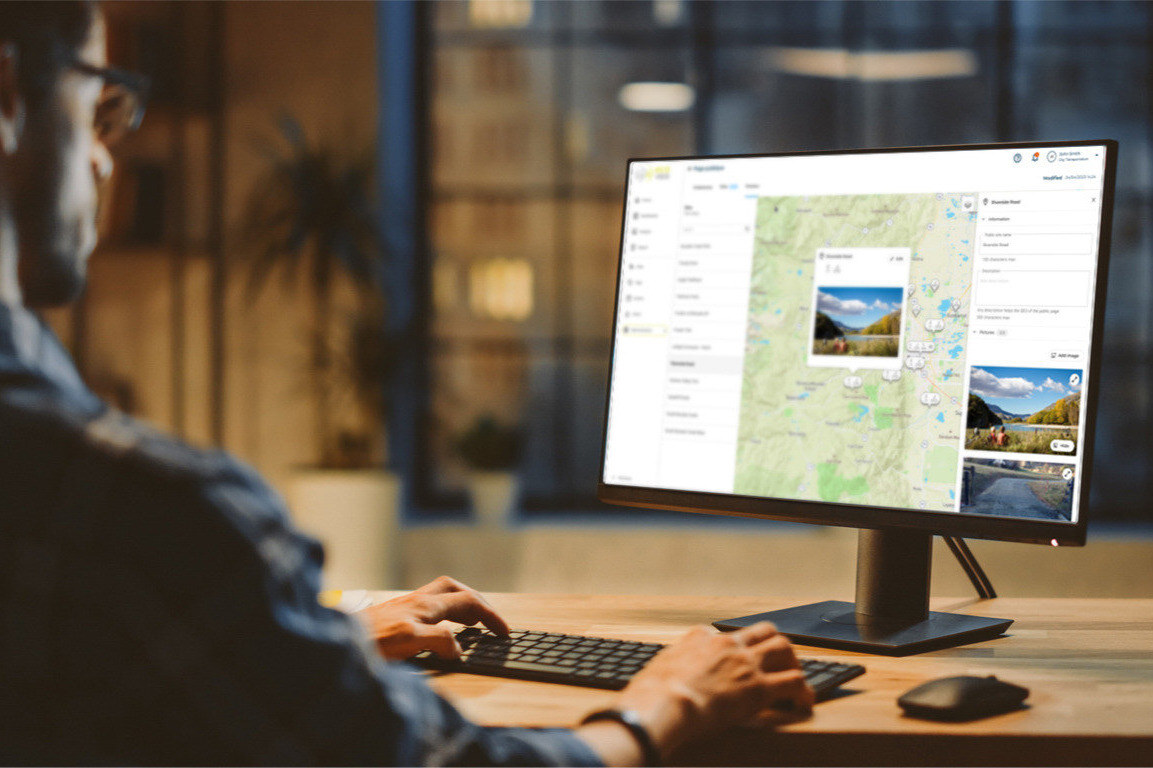
Traffic comparison in different weather conditions

Once you've identified that weather impacts pedestrian and cyclist traffic, how do you take this into account when developing active transportation?
One way is to group weather conditions and compare how count volumes differ. A feature in our Eco-Visio analysis software lets you calculate the average number of pedestrian and cyclist counts from one year to the next on days with comparable weather conditions (for example, days without rain, days above a certain temperature, etc.).
From there, you can see the traffic difference in favorable vs. unfavorable weather and make decisions or predictions based on these concrete factors.
Most impactful weather condition on count volumes
When it comes to pedestrians, cyclists, and other active modes, which weather condition affects them the most? Is it the amount of rain? Snow? Average temperature? Winds speed?
It all depends on the people who live in your city or community. In San Diego County, for example, a study we conducted for the San Diego Association of Governments (SANDAG) found that temperature was a major factor in cycling, with ridership dipping significantly if it was under 66 °F (19 °C). In Montreal however, temperature had much less impact on cycling. Instead, amount of rainfall was a much greater indicator.
Other common factors for low counts include absence of sunshine, total duration of rain, and wind speeds. Knowing what affects your citizens most gives you the insights on how best to keep them comfortable and safe.


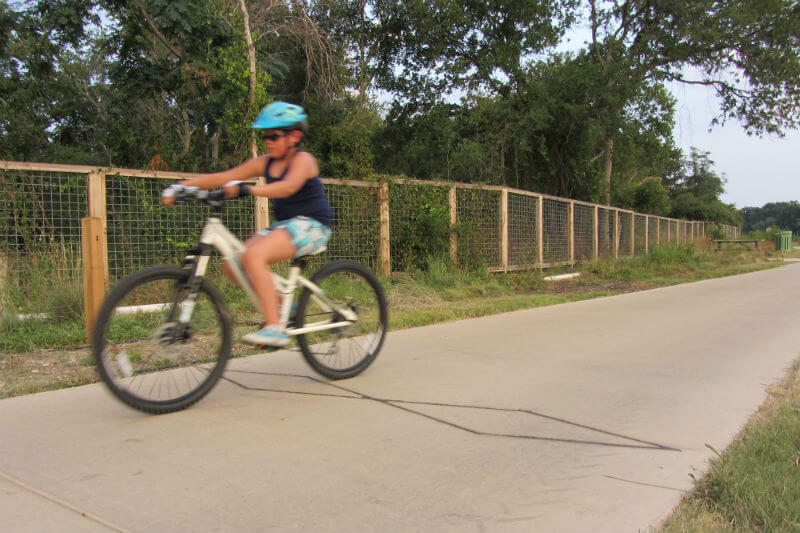
Case study: Houston, Texas
Houston, Texas experiences extreme heat in the summer, accompanied by heavy rain.
The biggest challenge facing cyclists in Houston is the high daytime temperatures during the summer months; cycling in these conditions, without shade, can be unpleasant and even dangerous.
A study carried out by the Houston-Galveston Area Council on a trail leading into downtown Houston found that citizens were using the trail for leisure rather than utility. This was evident as weekends and holidays recorded the highest volumes of cycling.
An analysis of ridership and weather data supported this idea. They saw that most cyclists used the trail when temperatures were lower and shade was more prevalent (i.e. at sunrise and sunset).
How Eco-Counter can help with traffic data analysis
Expertise
At every stage of your project (choosing count sites, selecting counting solutions, using analysis tools, etc.), our teams are here to help.

Support
Already have a project in mind? Contact us and our dedicated support team will help you get it started from square one.
Tools
Reliable hardware, user-friendly software, and guaranteed data quality: we provide a complete solution with products and services to get you the best possible data.
FAQ
How does weather impact pedestrian and bicycle traffic?
Weather affects how many people walk and bike, but often in unexpected ways. Rain, snow, heat, and cold can change travel patterns, trip timing, and route choice. In many communities, especially those with good infrastructure, usage stays surprisingly consistent even in poor weather.
What weather indicators help planners make decisions?
Key indicators when it comes to weather analysis include:
- Winter retention rate: A measure of the proportion of users who continue using active modes in the winter compared to the summer. A great way to see how well your facilities hold up for users in the colder months.
- Traffic in comparable weather conditions: Grouping days with comparable weather together (rainy days, sunny days, etc.) and comparing volumes over time. A more precise way to measure growth on your facilities.
- Most impactful weather condition: Measuring how much each weather condition (wind, rain, snow, etc.) impacts count volumes in percentages. Helps improve planning and develop infrastructure.
How can weather-adjusted data help justify funding requests?
Weather-adjusted data can help explain why usage changes and prove that long-term trends are stable or growing. This is especially useful for grant applications and funding requests. It shows decision-makers that short-term drops can be attributed to weather, not infrastructure.

Going further on user traffic analysis
Explore related topics and discover how data can be used in each situation:

Modal Share
& Space Allocation
How wide? Which direction? How much should it curve? Building pedestrian and bike facilities is no easy task, and requires reliable data to make the right decisions.
Communication
Communication with the public is a key part of active transportation development. Maximize the impact of communication campaigns using physical tools (roadside displays) and digital tools (data-sharing webpages) to show off your data.

Vision Zero
Security is a major topic for vulnerable road users such as pedestrians or cyclists. Vision Zero is an international project around safety for users. Find out how count data can help you improve infrastructures to enhance user safety.