- Home
- Developing active transportation
- Communicating data to promote walking & cycling
Communicating Active Transportation Data to Promote Walking and Cycling
Why communicating pedestrian and bicycle data matters
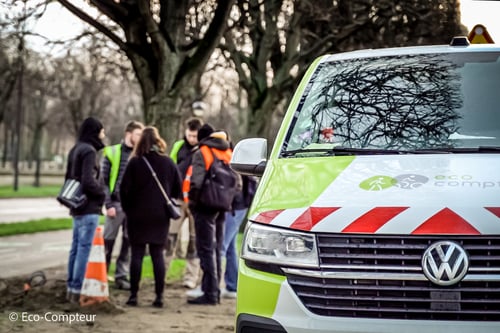
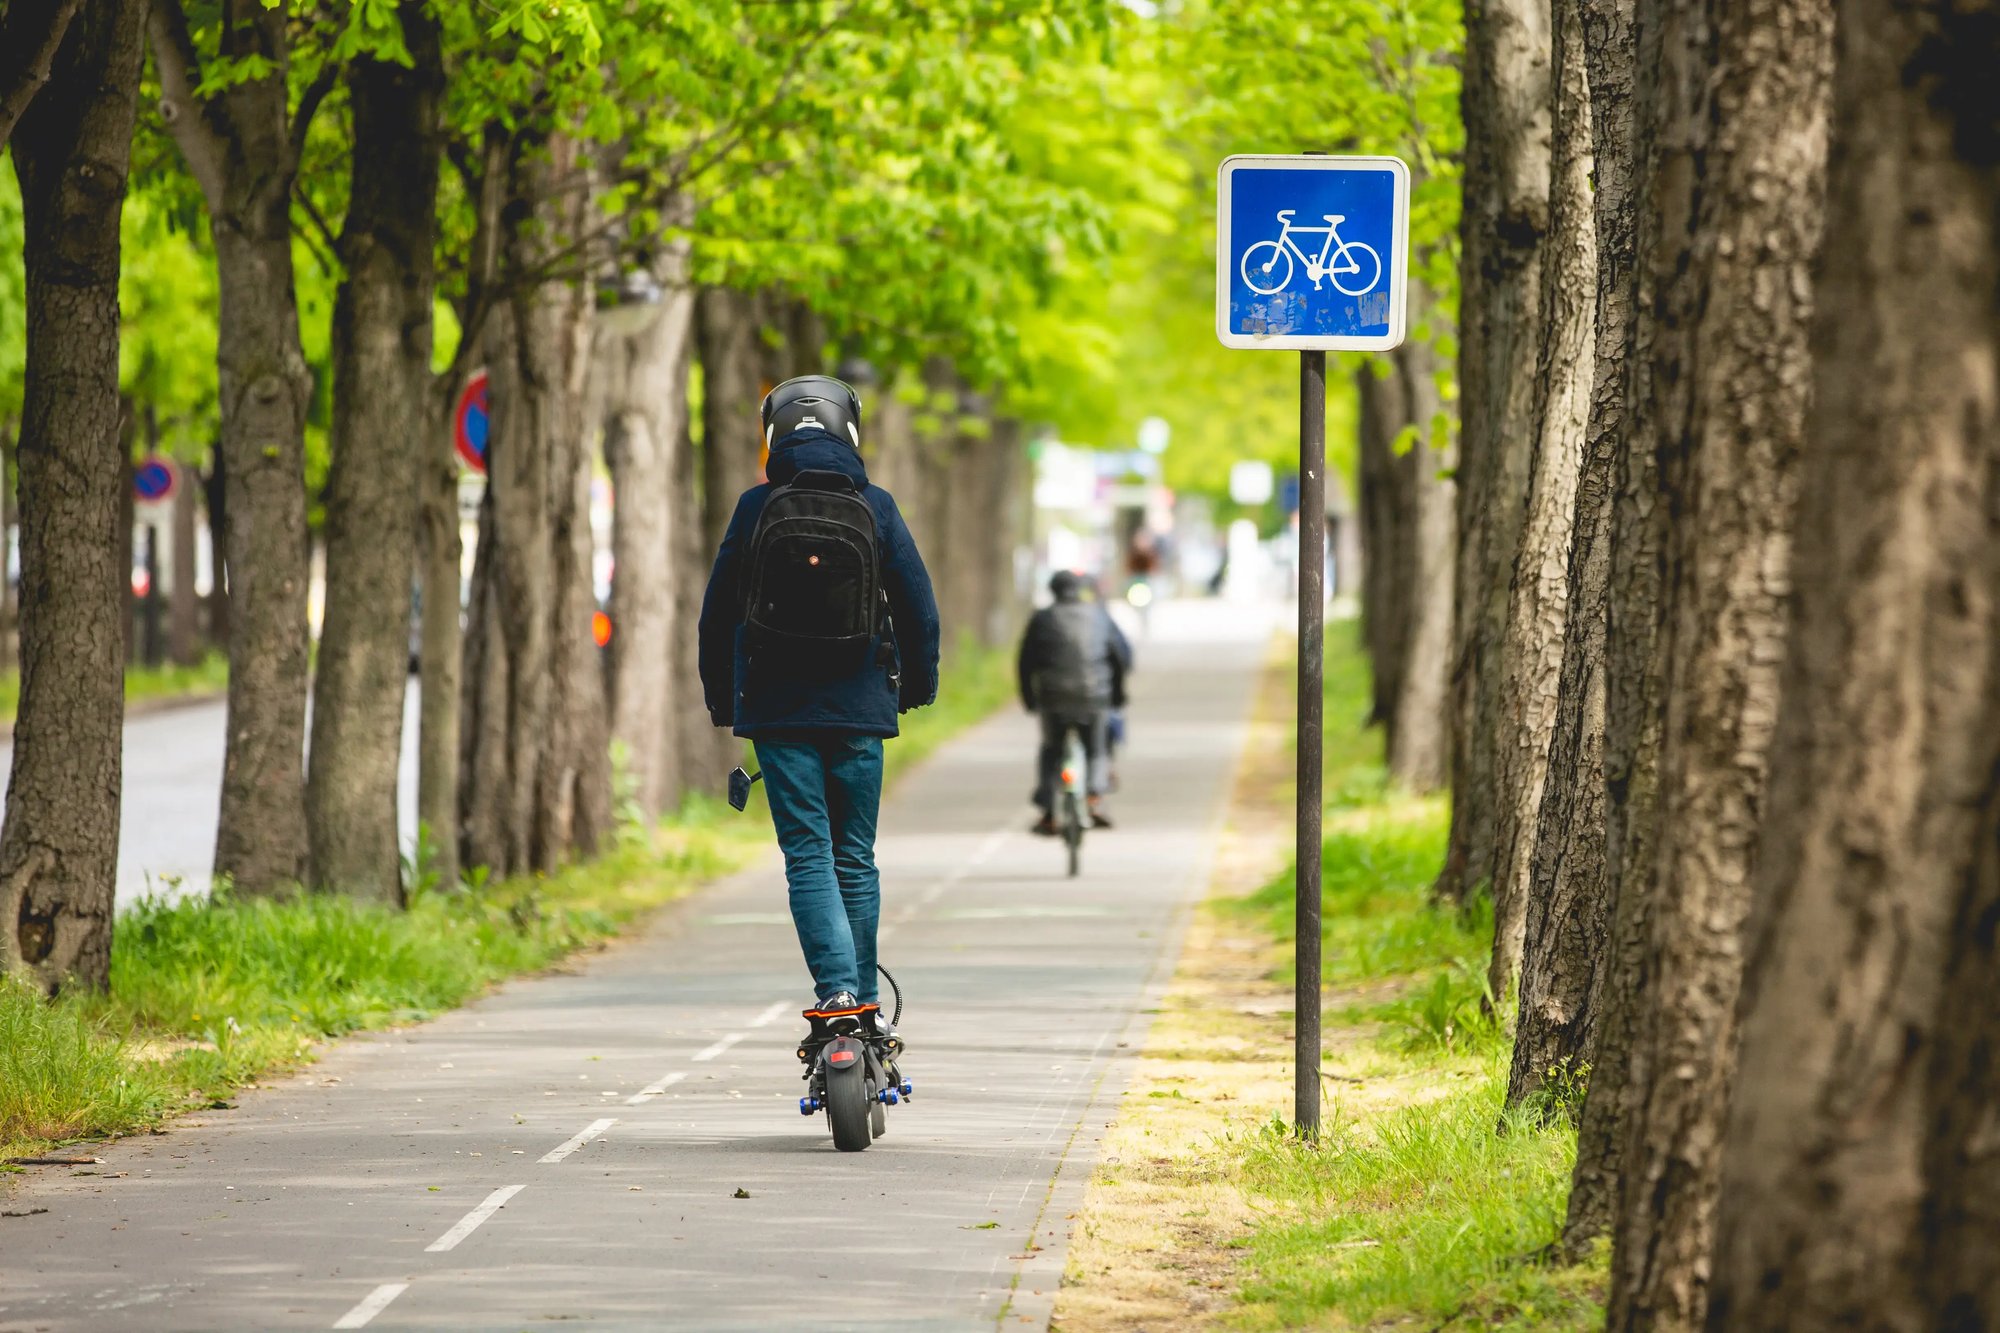
Walking and cycling are such everyday activities that they are often overlooked. Measuring traffic from pedestrians, cyclists, scooters, and other active modes often reveals surprising volumes of traffic.
Public communication of count data plays a crucial role in making active transportation popular. For example, a great strategy to inspire behavior change in citizens is to show them how many others in their community are walking or biking. Similarly, showing off count data creates public support for active transportation projects by demonstrating their real-world impacts.
.webp?width=1500&height=1500&name=AdobeStock_351370549%20(1).webp)
What indicators should you share with the public?
Average daily counts
How many people walk or bike everyday in your area?
Year-over-year growth
Is walking and cycling increasing compared to last year?
Busiest days / months of the year
When are people walking or biking most?
Before and after project comparisons
Are people using your new bike lane or pedestrian sidewalk?
Effect of events
Are people walking or biking to events in your city?

How cities use data to win public support
Sharing key figures
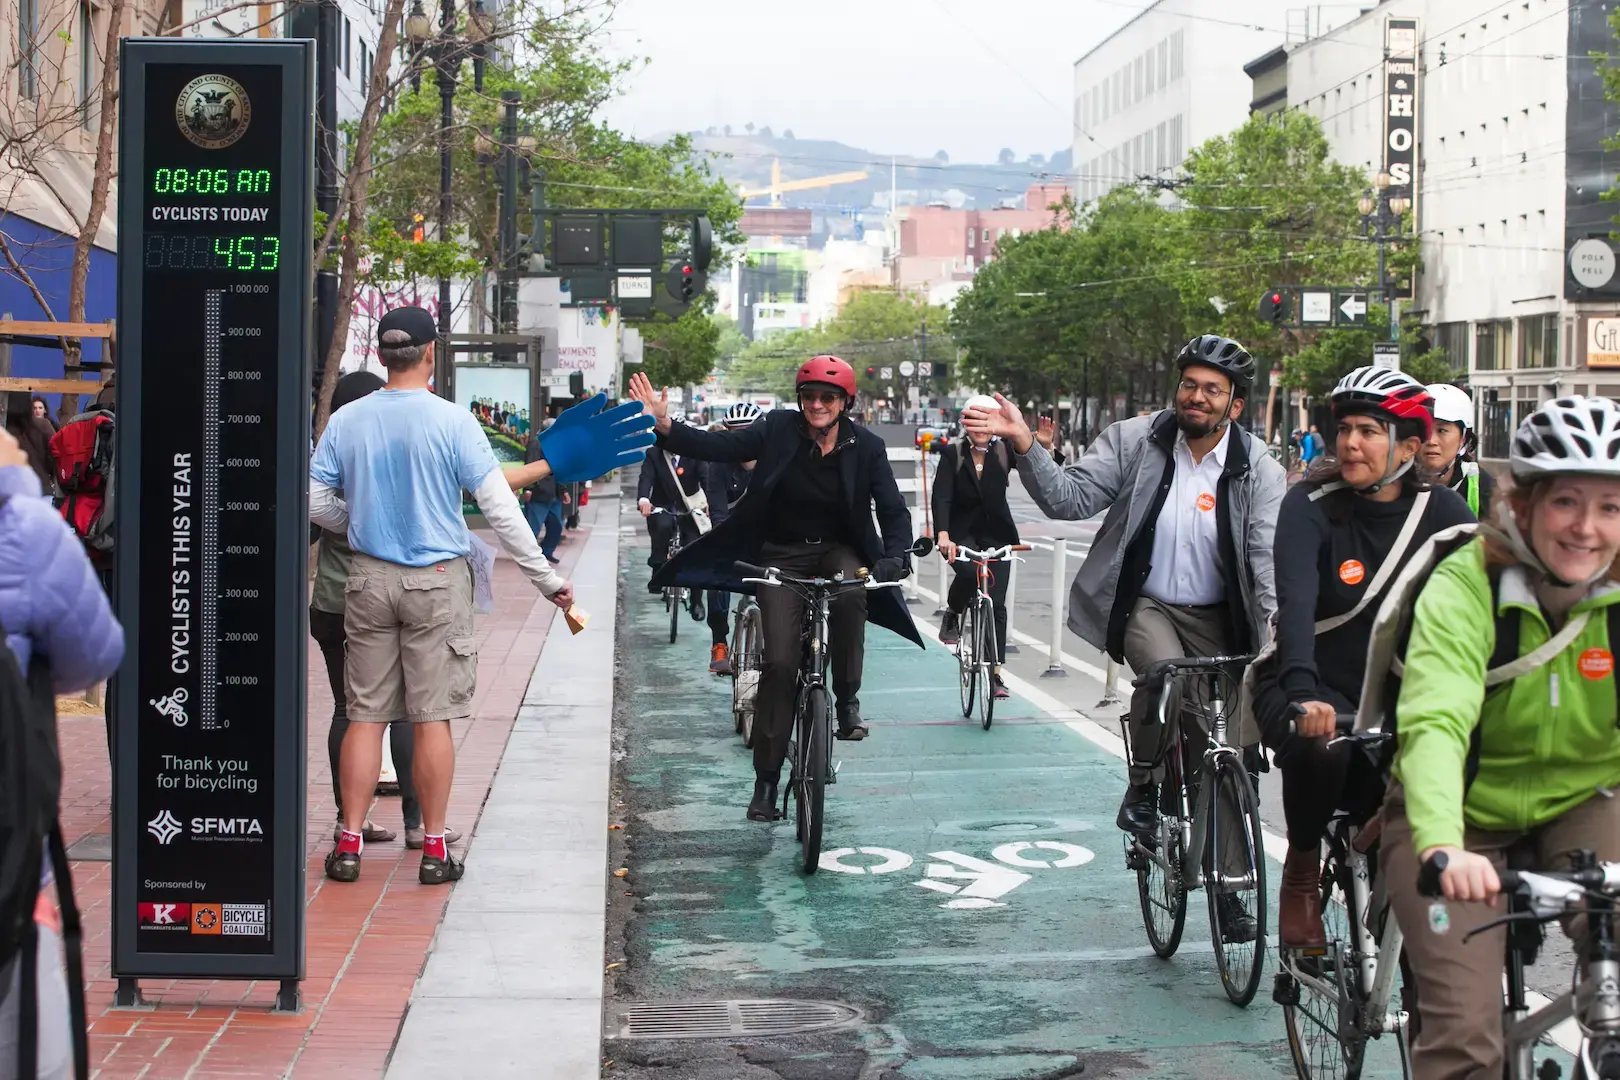
Count data adds value to communication with simple, effective, and impactful figures. All over the world, our Eco-DISPLAY counters provide a fun way of showing citizens statistics like pedestrians and cyclists this year, current date, time, temperature, and even CO2 saved.
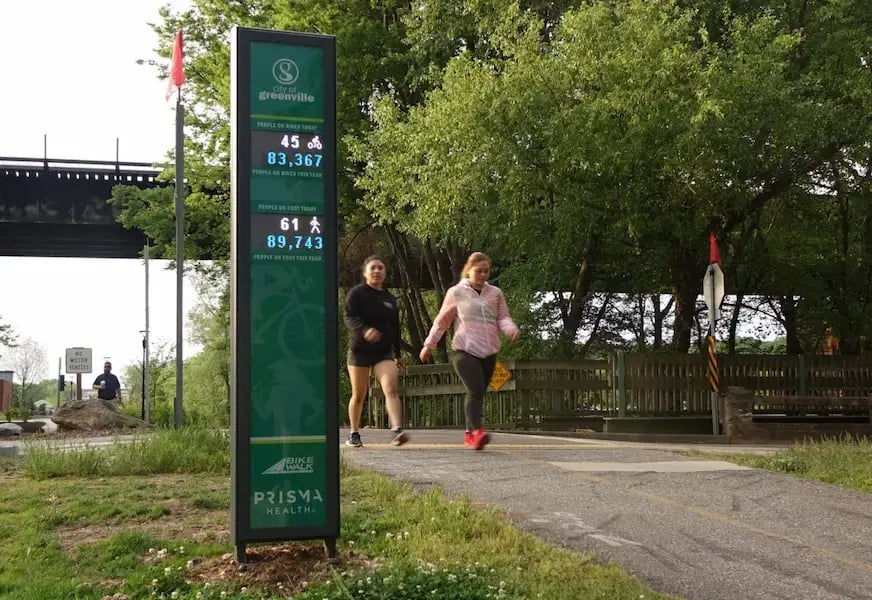
In Greenville, South Carolina, their Eco-DISPLAY Classic+ shows a live count of pedestrians and cyclists on one of their multi-use trails (shown right).
Some cities also install multiple Eco-DISPLAY Classic+ displays showing the number of bike counts and the total CO2 saved from bike trips. An excellent way of communicating the environmental benefits of cycling!
Measuring the impact of an event

Sharing spikes in pedestrian or bicycle volumes following an event or bike tour is a great way to tell a story.
In San Diego County, Bike Anywhere Day is an annual event that encourages as many people as possible to replace their car journeys - to work, school, the grocery store, etc. - with bicycle trips for a day.
In 2024, Bike Anywhere Day saw a 40% increase in ridership in the region compared to days similar days throughout the year. This storytelling was great promotion for their event and can be used to get more people to participate next year.
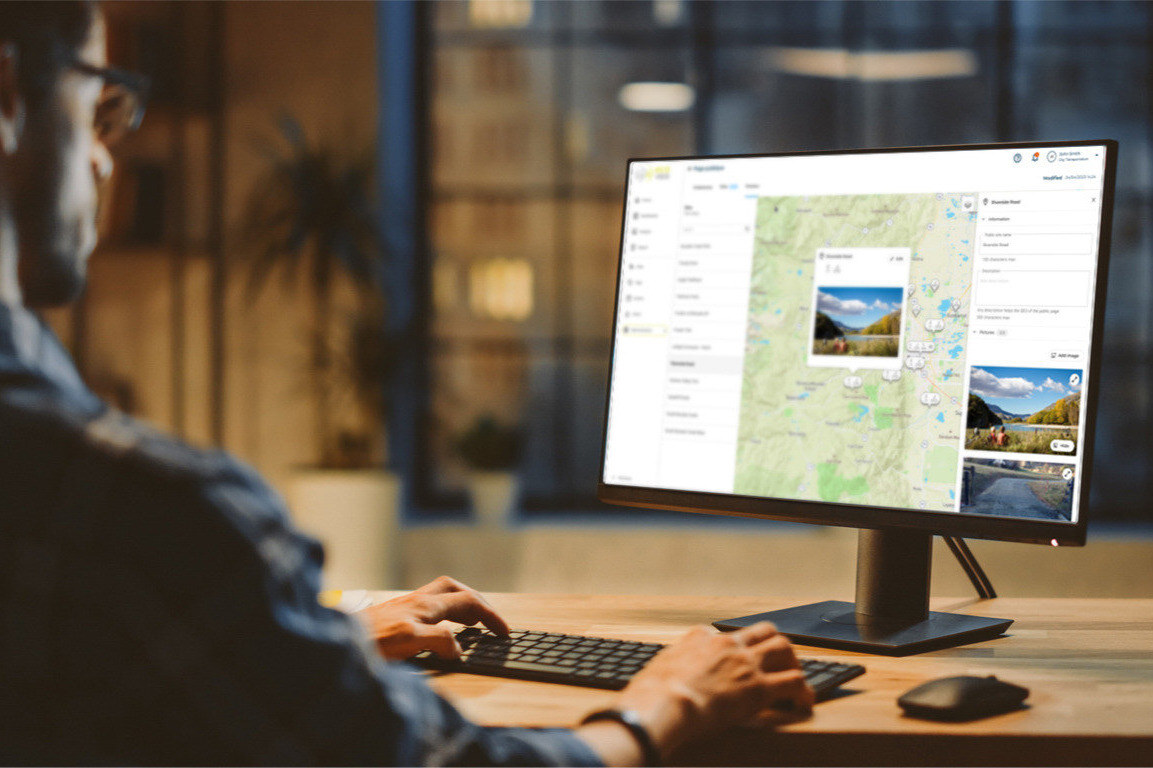
Publicizing data with online tools
Communicating on count data can be done through physical tools like displays, but it can also be done using digital tools.
Our data analysis software, Eco-Visio, lets you analyze count data with charts and share them on social media in just a few clicks.
Similarly, our Public Web Page enables you to share count data in real time on a webpage you control. On the page, visitors will find an interactive map with counter locations, count data, photos, and more. Check out an example of the Public Web Page of the City of Baltimore.
Finally, to maximize your data's usage and communication, our API Evo can integrate your count data with any other site or application.


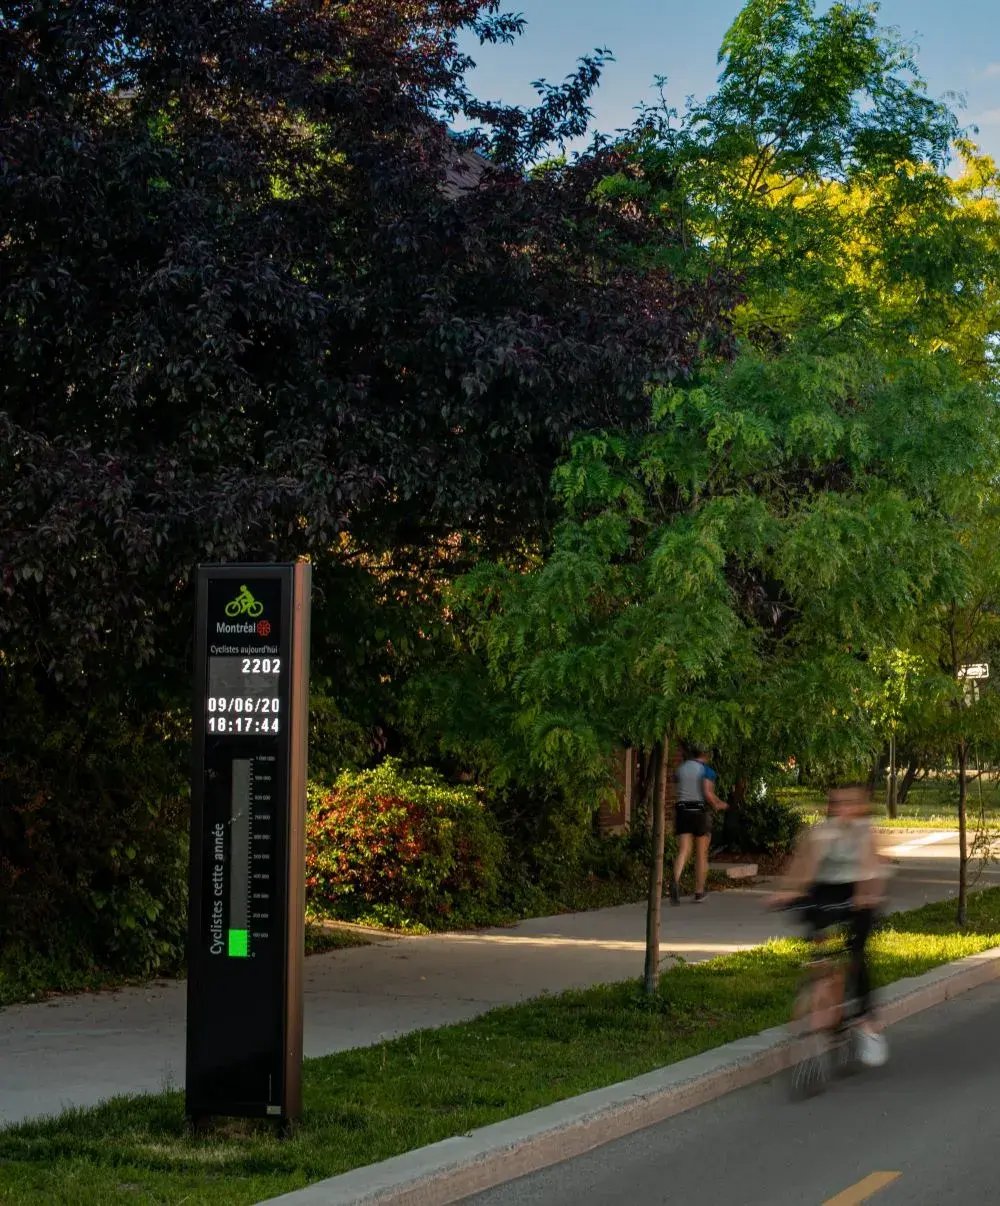
Case study: Montreal, Canada
A prime example data communication having an impact is the redevelopment Saint Denis Street in Montreal, Canada. As part of the city's new bike plan, the major arterial was completely redesigned. Before the change, there was no bike lane on the street and cars took up 70% of the space.
After the change, the city added a protected bike lane that took up 15% of the space, increased the pedestrian and green space allocation to 55%, and left 30% for cars. Of course, people were skeptical of the change. But, the City of Montreal's display counter and public bike data showed massive increases in cyclists year after year, improving traffic flow and prompting people to get on board with the project!
FAQ
Should cities share pedestrian and bicycle data with the public?
Yes! Sharing pedestrian and bicycle data is a great way to build trust and transparency. It shows residents that investments in sidewalks, multiuse paths, and bike lanes are yielding returns. It also helps local governments highlight safety improvements, support funding requests, and demonstrate progress toward goals like Vision Zero.
What types of data are most useful to communicate?
The best data to share includes:
-
Average daily counts of pedestrians and bikes
-
Year-over-year growth trends
-
Peak usage times
-
Before-and-after project comparisons
- Spikes in counts during events
These indicators are both simple to understand and show big impact to the general public.
How often should pedestrian and bicycle data be shared?
Many cities share data in real time, monthly, or annually. The right frequency depends on your goals. Real-time displays work well for public engagement, while annual summaries are useful for reporting and funding discussions. Consistency and accuracy matter more than frequency.
One example of real-time data sharing on a large scale is our Eco-Display World Map.
How Eco-Counter can help promote walking & cycling
Expertise
At every stage of your project (choosing count sites, selecting counting solutions, using analysis tools, etc.), our teams are here to help.
Support
Already have a project in mind? Contact us and our dedicated support team will help you get it started from square one.
Tools
Reliable hardware, user-friendly software, and guaranteed data quality: we provide a complete solution with products and services to get you the best possible data.
Going further on active transportation development
Explore related topics and discover how data can be used in each situation:
Trend Monitoring
Usage and trend data measure the impacts of infrastructure projects and various factors on walking and cycling. Basing decisions on reliable data is the key to a safe city that prioritizes public health and fights climate change.

Vision Zero
Vision Zero is an international traffic safety project that aims to eliminate deaths or serious injuries on road networks. This initiative calls for specific data on vulnerable road users such as pedestrians and cyclists.

Weather Impacts
The effects of the weather (rain, snow, heat, wind) on active modes are indisputable but often misunderstood. Analyze how weather causes behavior changes and make the right decisions about infrastructure maintenance.