- Home
- Developing active transportation
Developing active transportation
Why is urban mobility so important? Because it creates more liveable communities. When more people walk and cycle, travel is more efficient, public health improves, and the environment benefits.
But, it's not always simple to increase active transportation in cities, states, or counties. Pedestrian and bicycle safety, mode share allocation, and trend monitoring are all common roadblocks. Luckily, data empowers you to tackle these challenges and transform your city for the better.

Clients we work with:


Building the cities of tomorrow:
.webp?width=1500&height=1000&name=AdobeStock_496911858%20(1).webp)
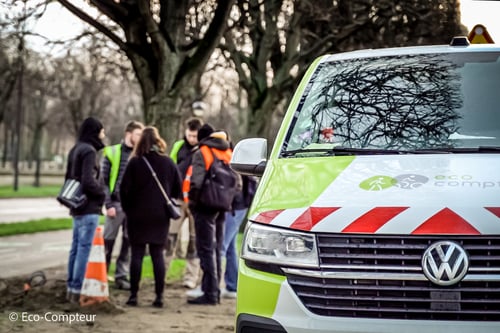
Monitoring active transportation trends
Usage and trend data measure the impacts of infrastructure projects and other factors on walking and cycling. Basing decisions on reliable data is the key to a safe city that prioritizes public health and fights climate change.
.webp?width=1501&height=1000&name=AdobeStock_963764728-1%20(1).webp)
Safety for cyclists & pedestrians
Vision Zero is an international traffic safety project that aims to eliminate deaths or serious injuries on road networks. This initiative calls for specific data on vulnerable road users such as pedestrians and cyclists.

Weather impacts on walking & cycling
Weather often has significant and unexpected effects on urban mobility. Understanding the behaviors caused by each weather condition can greatly improve planning and resource management.
.webp?width=1200&height=800&name=HD_ECO_DISPLAY_CLASSIC_COM_USA_SFMTA_Purchase%20from%20Myleen%20Hollero%20(1).webp)
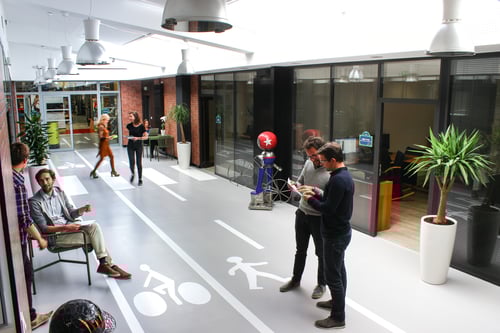
Communicating data to promote walking & cycling
Sharing urban mobility data like cycling volumes or infrastructure usage shows accountability and generates community support. It can even create behavioral change and prompt more people to choose active modes.
.webp?width=1199&height=800&name=AdobeStock_71531619%20(1).webp)
Modal Share
& Space Allocation
How wide? Which direction? For whom? Building pedestrian and bike facilities is not easy. It requires reliable data to make decisions that serve the groups that need them most.

Monitoring bike trends in San Diego County
How does the San Diego Association of Governments (SANDAG) use count data and active transportation monitoring to learn about cyclists in San Diego County?
On their annual Bike Anywhere Day event, citizens across the region were encouraged to replace their car trips with bike trips for an entire day. With the help of volunteers, organizations, and businesses in the community, SANDAG found that the event increased bicycle ridership by 40% compared to typical volumes. This massive success was shown in the data thanks to their long-term count program that tracked annual cycling trends.

Our philosophy
For over 20 years, Eco-Counter has specialized in collecting and analyzing count data to help transform cities.
We built our company around innovations that provide "ground-truth" data, or data that represents the reality of what is happening on networks of any size. This essential foundation allows us to provide support and expertise for responding to challenges such as improving public health, building a safe city, monitoring park use, and tackling climate change.
We offer turnkey solutions (hardware and software) or customized services (installation, maintenance, data analysis, etc.). In both cases, responsive support and customer service help you get the results and answers you need.
How we help
Expertise
At every stage of your project (choosing count sites, selecting counting solutions, using analysis tools, etc.), our teams are here to help.
Support
Already have a project in mind? Contact us and our dedicated support team will help you get it started from square one.
Tools
Reliable hardware, user-friendly software, and guaranteed data quality: we provide a complete solution with products and services to get you the best possible data.
FAQ on active transportation
How do cities measure active transportation?
Many cities measure active transportation with automated counters that track volumes of pedestrians, bikes, scooters, vehicles, and more. These counters collect data year-round, so you can see daily, weekly, and seasonal trends.
There are also solutions that use data from mobile phones and other sources to generate urban mobility insights, though these often present challenges with biases and data transparency.
What can active transportation data tell us about our network?
Pedestrian & cyclist traffic data show how people move. You can see peak hours, weekday vs weekend trends, seasonal changes, special-event spikes, and long-term growth. This helps you make smart planning decisions, track project success over time, and win grants or funding.
If you have questions about your specific situation, you can always get in touch with us to figure out what's possible for you.
How much maintenance do automated counters require?
Very little. Most automated counters are weather-proof and built to operate year-round in tough urban environments. Beyond replacing batteries yearly (or less frequently depending on the counter), there isn't much to do in terms of maintenance.
At Eco-Counter, our support team can help you monitor counter performance and keep your equipment running smoothly.
Do other U.S. and Canadian cities use your counting solutions?
Yes. Hundreds of municipalities, counties, and MPOs across the United States and Canada use Eco-Counter solutions. You can explore our client map for a few examples of clients both large and small.