- Home
- Developing active transportation
- Monitoring active transportation trends
Monitoring active transportation trends
No matter the size of your city, human-powered movement is vital for safe, efficient, and healthy communities.
Walking, cycling, scootering, e-bikes, and more: growing interest in these modes of urban mobility have sparked discussions about how to integrate them effectively into urban environments. Data and trend monitoring reveal what happens on networks of any size, leading to smart, confident, and effective decision-making.
Why monitoring active transportation trends matters
The many benefits of active transportation for a community include:
-
-
Economic growth
-
Climate change reduction
-
Improved mental and physical health
- Reduced traffic congestion and increased transportation resilience
-
In the US, over 50% of trips are under three miles, an ideal distance for walking, cycling, or scootering. Yet, mode share for walking and biking in North America is only 4%, over five times less than the global average of 22%.
Much of the uncertainty about adopting active modes comes from a lack of reliable data. With bike and pedestrian traffic data, you can make impactful decisions on which facilities to build, where to build them, and for whom. A long-term count program yields benefits for years down the line.
Key indicators for active transportation planning
Bike and pedestrian traffic data can give you several indicators to evaluate walkability, biking trends, infrastructure effectiveness, and more on your streets.
Hourly Profiles

Looking at volumes by the hour can reveal the "nature" or common use case of a facility.
A "utilitarian" facility is identified when traffic peaks during the morning and evening (commute times), whereas a "leisure" facility peaks in the afternoon and on weekends.
Average Daily Traffic

Measuring daily traffic volumes provides a baseline figure of your infrastructure use.
When an infrastructure often experiences high speeds and high volumes, this can be a sign of overcrowding and greater crash risk.
Year-Over-Year Growth

Comparing total count volumes by month or by year lets you see clear long-term trends.
This analysis is invaluable when developing active transportation and identifying where improvement is needed.
Before-and-After Analysis

Having consistent pedestrian and bicycle counts means being able to quantify changes.
Once your average volume is known, you can measure the before-and-after of any new infrastructure project. For example, if the creation of a bicycle lane resulted in more bikes or not.
Modal Share

Knowing which transportation modes people prefer can be invaluable in transportation projects.
With multi-modal counting solutions, determining mode share is automatic. From there, streets can be adapted to better suit the people who use them, leading to more walkable cities, bike-friendly neighborhoods, and more.
Weather Impacts

Do temperature, precipitation, and wind affect active mobility trends? If so, by how much?
See how weather affects the fluctuations of pedestrians and bicycles on your streets. Then, make sure that your infrastructure takes into account people's behaviors in all weathers.
Cycling Insights and VisitorFlow, two solutions for a 360° view of urban mobility
For a deeper view of an active mobility network, we created an advanced solution that cross-references ground-truth count data with floating data (from GPS, mobile applications, and cellular devices).
With this, cities and communities can see more aspects of their active transportation infrastructure, such as the average distance traveled, origin/destination matrices, desire lines, and number of trips per day.
The two solutions we have are: VisitorFlow, for pedestrian flows, and Cycling Insights, for bicycle analysis.

Montréal, Canada: using data to manage cycling policy
How is the city of Montréal in Canada, using bicycle count data to manage infrastructures?
Eco-Counter was asked to install several automatic counters in strategic locations, as well as real-time displays to show count volumes to people passing by. Read the testimonials of key decision-makers involved in the project and discover how cycling data contributed to the implementation of their plan.

How we help

Expertise
At every stage of your project (choosing count sites, selecting counting solutions, using analysis tools, etc.), our teams are here to help.

Support
Already have a project in mind? Contact us and our dedicated support team will help you get it started from square one.

Tools
Reliable hardware, user-friendly software, and guaranteed data quality: we provide a complete solution with products and services to get you the best possible data.
FAQ
What is active transportation data?
Active transportation data measures how people move without cars. This usually includes pedestrian and bicycle counts, sometimes scooters or other micromobility. The data shows how many people use your network, when they use it, and how usage changes over time.
What kind of data do we need to plan walking and biking infrastructure?
Most agencies start with a few simple indicators:
-
Pedestrian and bicycle volumes
-
Peak hours and seasonal patterns
-
Usage by day-of-week (weekly profiles)
-
Year-over-year change
You do not need complex analyses to make an impact. Clear trends are often enough to guide planning and justify action.
How should I start measuring my pedestrian and bicycle traffic?
Typically, most organizations measure traffic using automatic counters installed along trails, sidewalks, bike lanes, or roadways. These solutions collect continuous data, 24/7, and store it in software where it can be analyzed and shared.
Going further, measuring active transportation can involve both quantitative and qualitative data.
Quantitative data
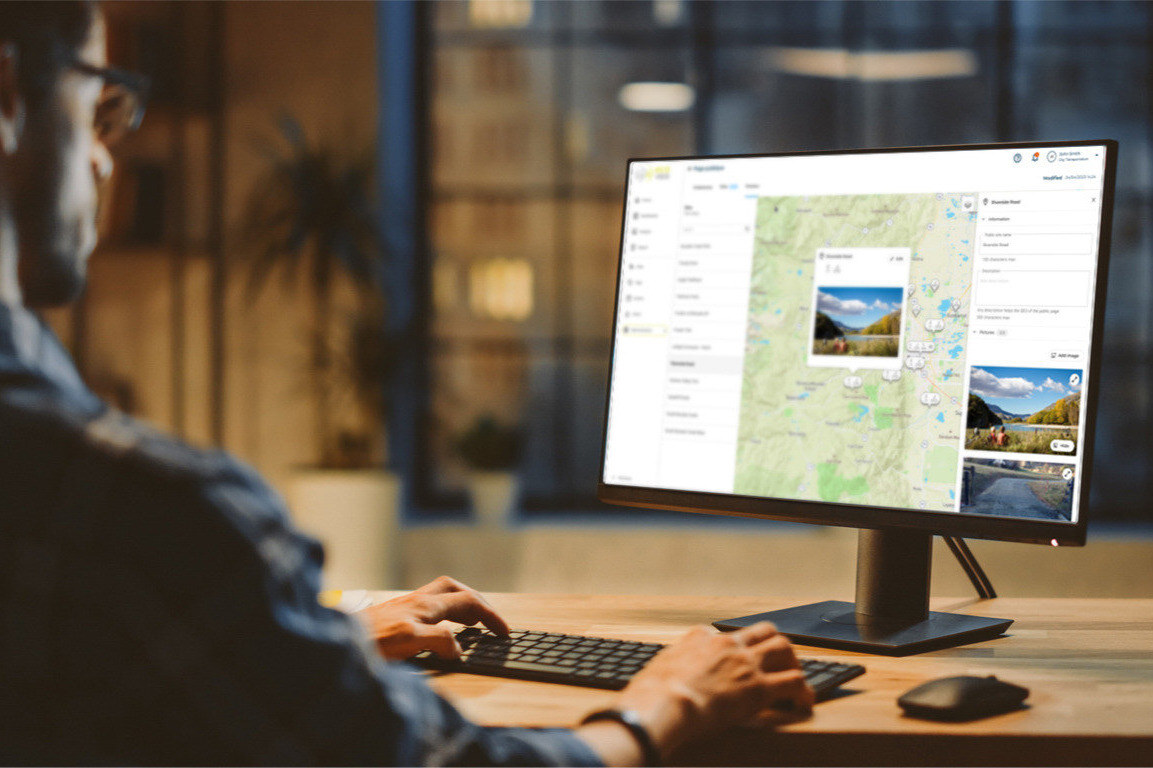
Quantitative data is used to construct key indicators such as total pedestrian and cyclist traffic, long-term volume trends, average journey time, average distance traveled, and average speed. They can also be used to compare different areas using standardized figures such as Average Annual Daily Traffic (AADT).
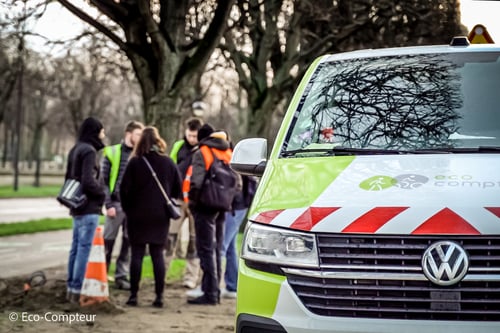
Automated counters are a method of collecting this quantitative data. The advantage of automatic counters is that they collect reliable and unbiased ground-truth data, leading to accurate decision-making.
Qualitative data
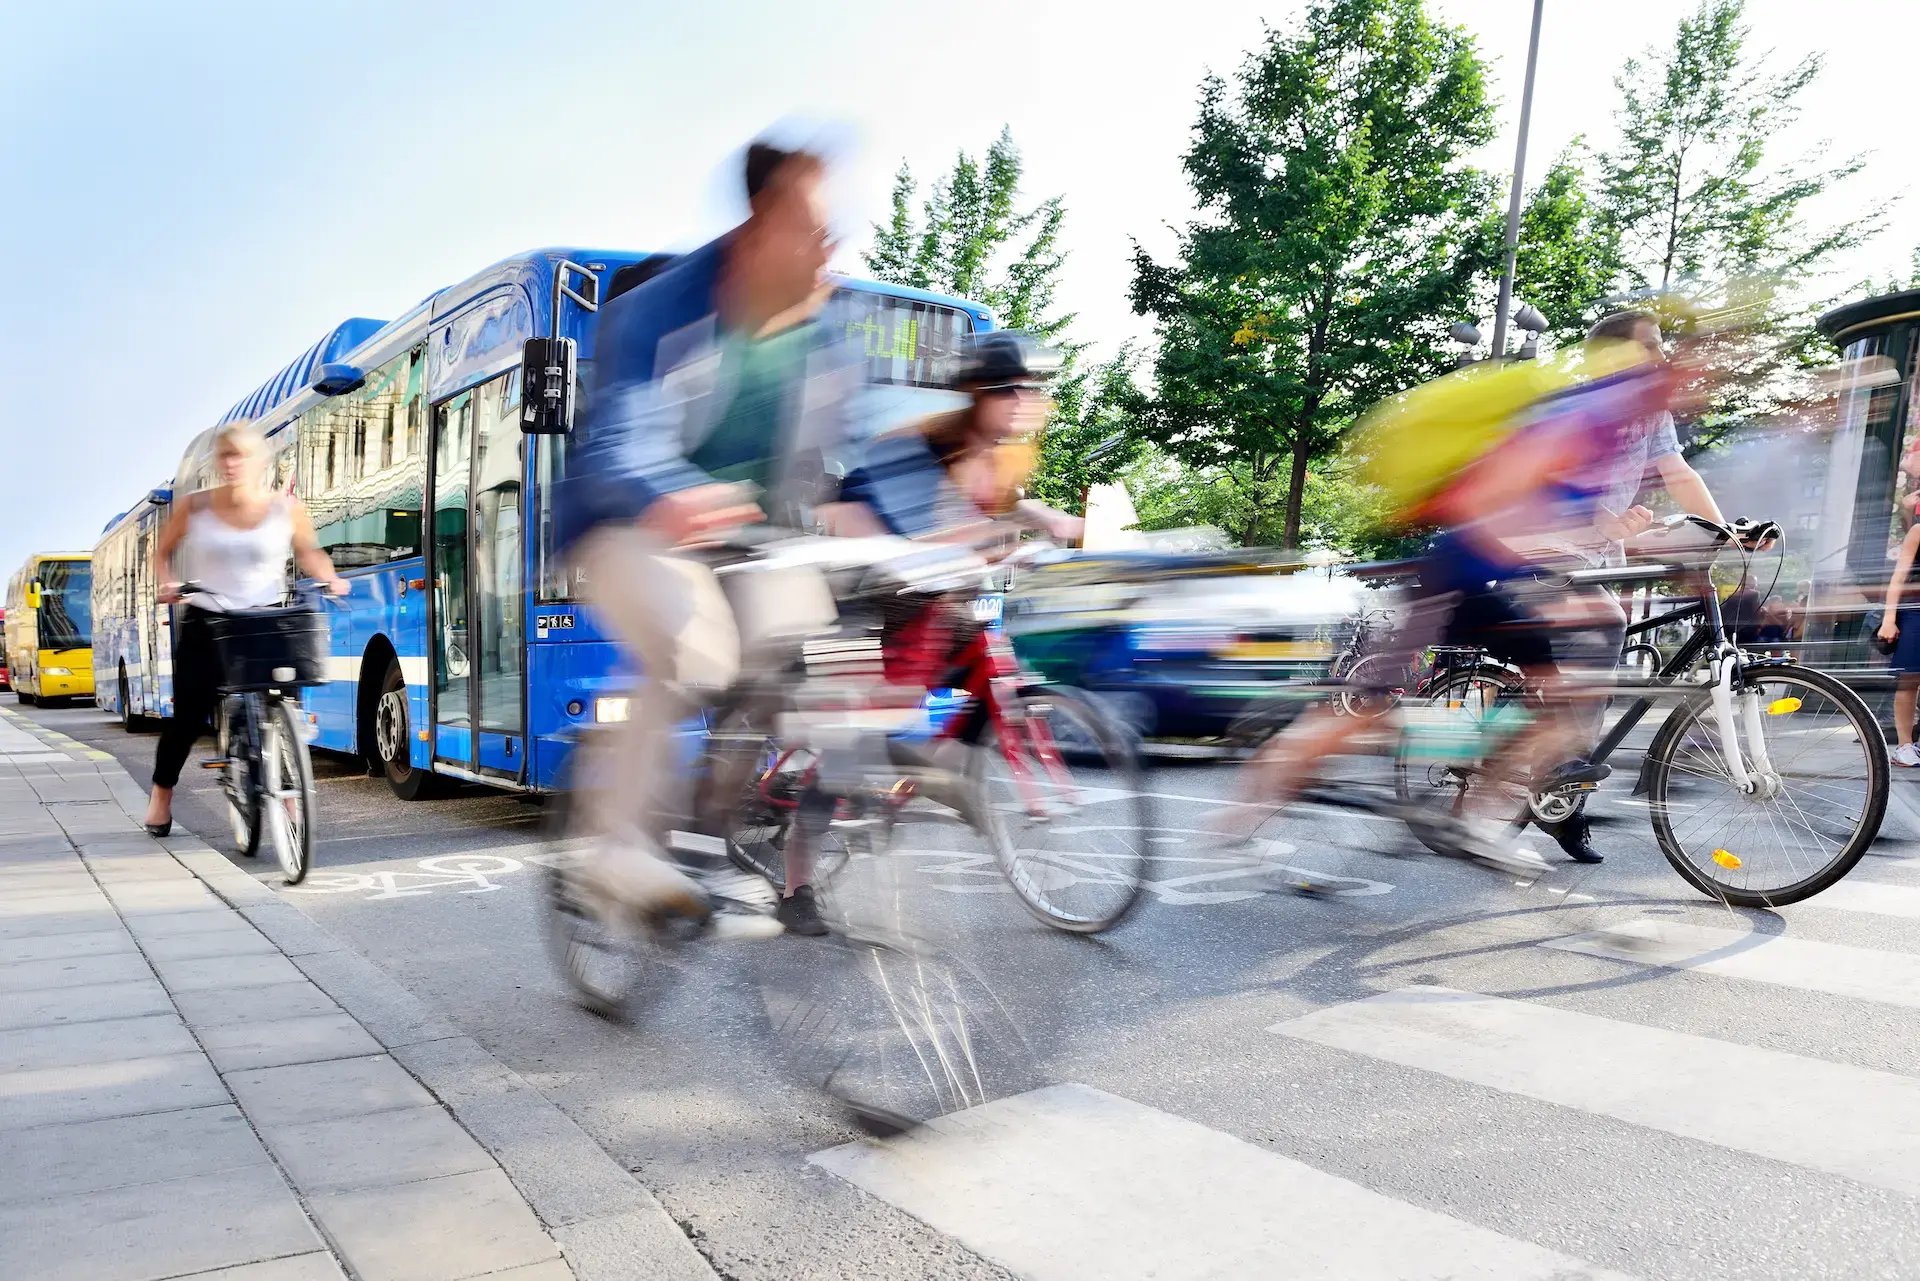
Qualitative data can also be collected to understand certain qualities of your users, notably through surveys. For example, demographic information, type of bike, or helmet use. That said, there are tools that can automatically collect qualitative data, such as the CITIX-AI Evo or VisitorFlow.
How long does it take to see meaningful trends?
You can see useful patterns in just a few weeks.
That said:
-
3–6 months shows seasonal behavior
-
12 months provides a strong baseline
-
Multiple years reveal long-term growth or decline
The longer you collect data, the more confident your decisions become.
Going further
Explore related topics and discover how data can be used in each situation:

Modal share
& space allocation
How wide? Which direction? For whom? Building pedestrian and bike facilities is no easy task and requires reliable data to make the right decisions.

Vision Zero
Vision Zero is an international traffic safety project that aims to eliminate deaths or serious injuries on road networks. This initiative calls for specific data on vulnerable road users such as pedestrians and cyclists.

Weather Impacts
The effects of the weather (rain, snow, heat, wind) on active modes are indisputable but often misunderstood. Analyze how weather causes behavior changes and make the right decisions about infrastructure maintenance.