- Home
- Eco-Visio
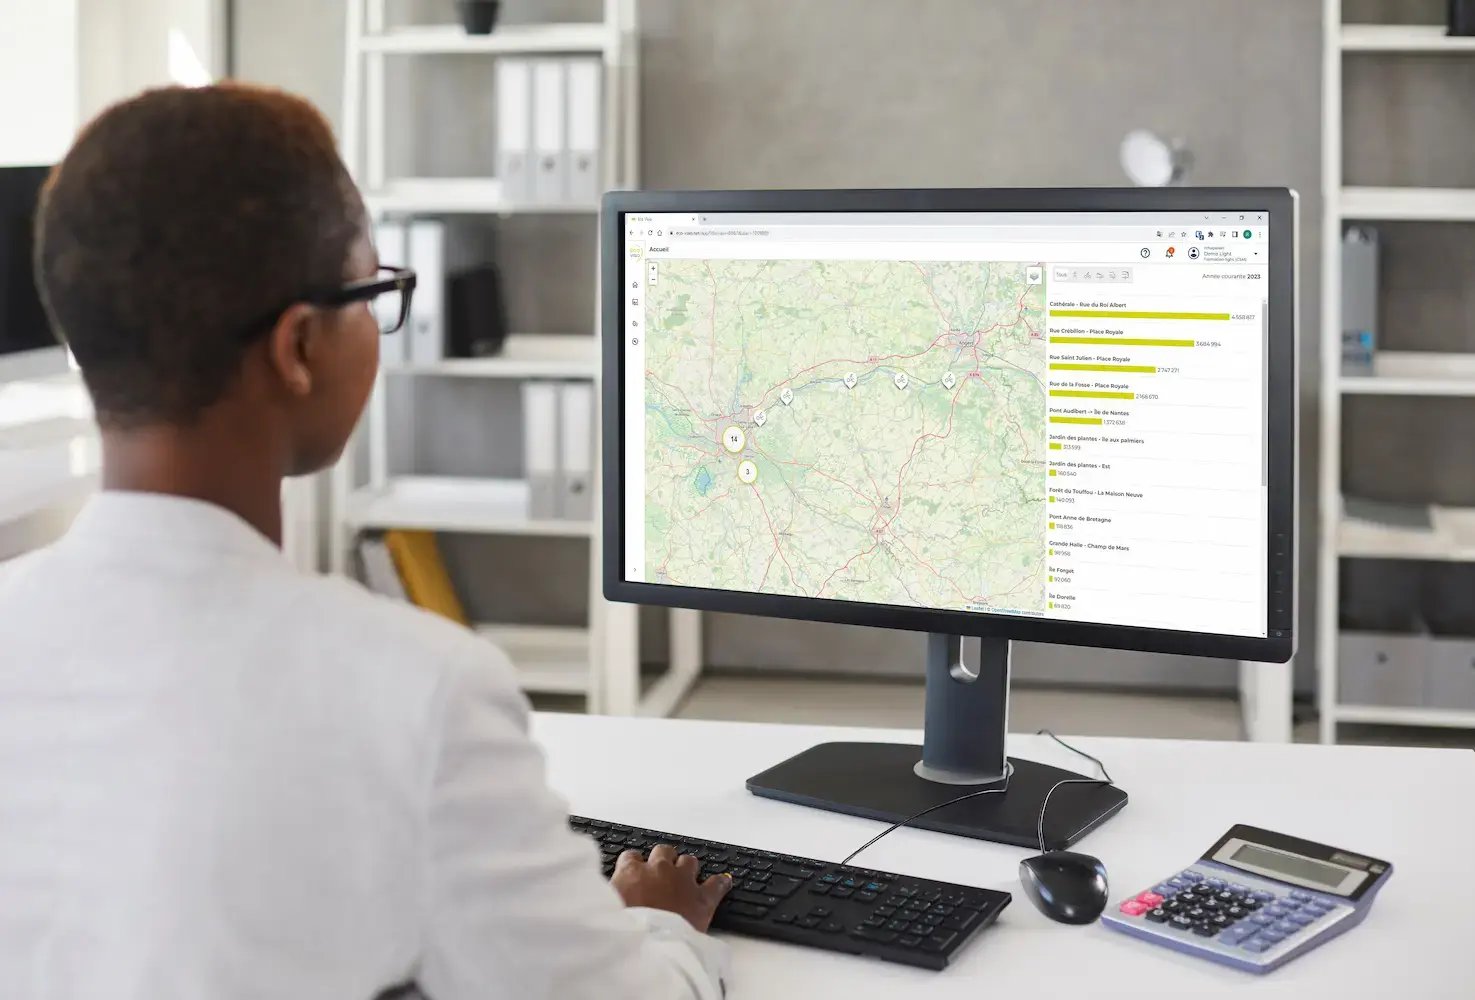
Our data analysis platform: Eco-Visio
When it comes to planning urban spaces or managing outdoor recreation, the data you collect needs to be made actionable.
That's why we created Eco-Visio, an easy-to-use hub where you can view, manage, and analyze data in an instant, even if you aren't a data expert.
Data analysis, data quality monitoring, and counter status: find all the information you need and the answers to your questions in an all-in-one suite.

How does it work?
All of our counting solutions are equipped to transmit data directly to your Eco-Visio account.
From there, Eco-Visio can be accessed on any computer, smartphone, or tablet with an internet connection. Once logged in, you can view data, analyze data, and create custom graphs and reports. Integrated tools also allow you to share raw data or reports with your partners. What makes Eco-Visio a powerful analytics platform? The number of key insights you can get in just a few clicks, including:
-
-
Hourly, daily, and monthly profiles
-
Volume comparisons between sites
-
Heat maps
-
Weekend vs. weekday averages
-
Mode share analysis
-
Weather effects analysis
-
Smart, relevant indicators
More than a simple data analysis tool, the Eco-Visio platform integrates 20+ years of business expertise we've gathered from our clients around the world.
That's why our platform features relevant, targeted indicators that specifically help organizations in urban transformation and outdoor recreation. Change the way you view data with the help of an analytics platform that thinks the way you think.
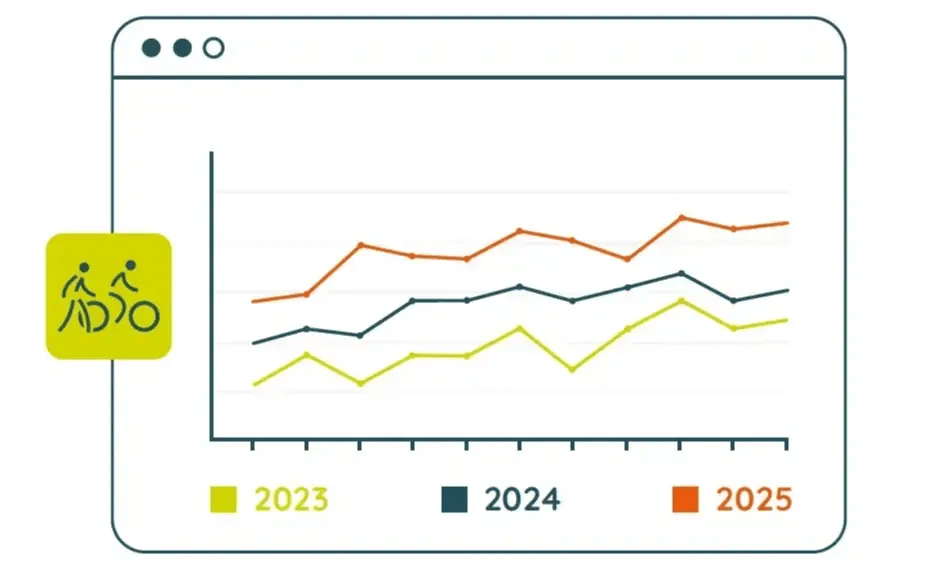
Long-term Trends
Comparing total count volumes by month or by year lets you see clear long-term trends.
This analysis is invaluable when determining the overall state of active transportation facilities and identifying a need for improvement.
.webp?width=1063&height=637&name=profil-horaire(1).webp)
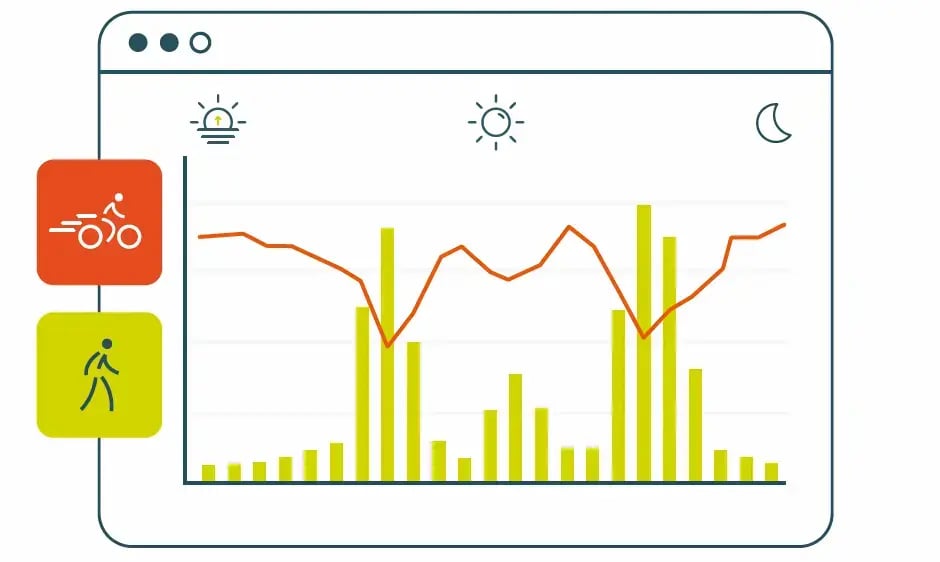
Profiles & seasonality
When looking at count volumes on a bike path or multi-use trail, the hourly profile reveals a lot about how people use the facility. For instance, a bike path with daily peaks at 9am and 5pm suggests that it is primarily used by people going to work.
Speed and Traffic
Measure how fast bikes, e-bikes, and e-scooters go to inform your decisions on safety and conflicts of use. Should pedestrians be given their own sidewalk instead of a multi-use path? How much should a bike lane curve to reduce speeds and crashes? Should signs be put up to regulate how fast people go? Incorporating speeds is a way to analyze data at a higher level.

Weather analysis
Rain, wind, and cold temperatures are often perceived as major obstacles to cycling or walking. Using Eco-Visio's weather analysis feature, you can concretely measure the impact of weather on count volumes and make the right planning decisions, without over- or underestimating the impact of the weather. Often times, favorable or unfavorable weather makes a difference, but the degree of change is usually a mystery.
Events
Before and after studies are essential ways to track the success of your projects. Eco-Visio elevates this analysis by taking special events and public holidays into account, giving you a more accurate picture of the effects of your actions.
When you view data without factoring in events, you might be missing out on key information. For instance, an increase in counts may be linked to the new facility, but also to a public holiday or a special event like a marathon.


Predicting visitor numbers
With the “Prediction” feature of your Eco-Visio data analytics platform, you no longer need to worry about bank holidays, unusual weather, or local events. You’ll anticipate visitor numbers and avoid peak periods and their negative consequences: long lines, overworked staff, and full parking lots...
Anticipate peak traffic. Alert your teams and optimize signage before the site becomes overwhelmed.
Eco-Visio allows you to forecast hourly traffic over a 4-day rolling period. Linked to the weather, your calendar, and seasonal trends, this forecast is based on one year of historical data.

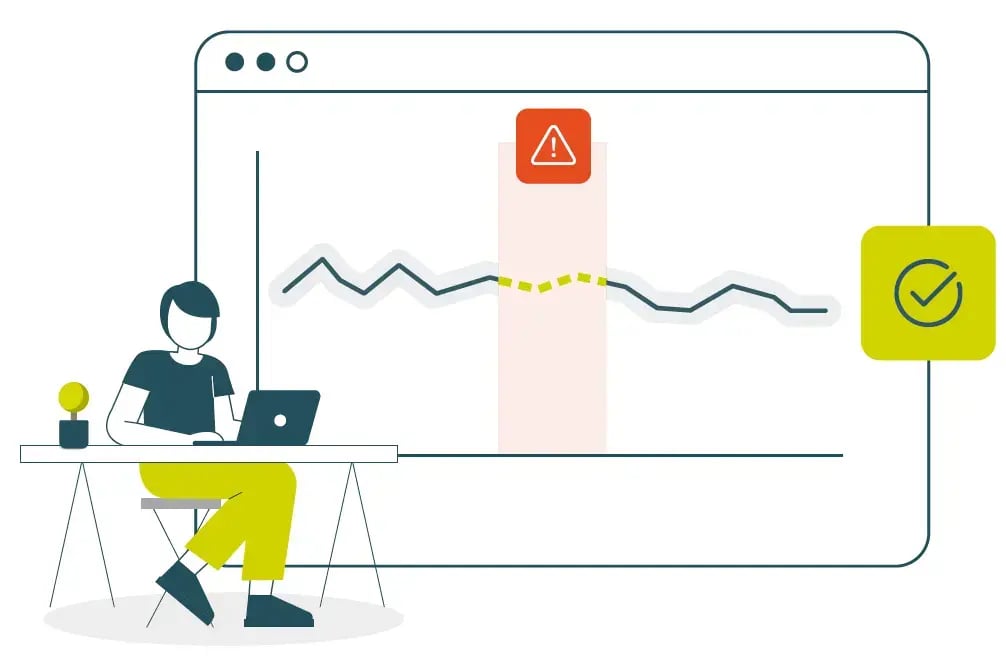
A tool for data management and quality assurance
In addition to generating powerful analyses and dashboards, Eco-Visio also monitors and manages the quality of your data.
Even with the best counters, external factors can interrupt your counts, creating null or abnormal count data. To ensure your decisions are based on complete information, Eco-Visio includes a fully-integrated feature that detects anomalies and corrects them if necessary.
For longer periods, our data experts will reconstruct your missing or inconsistent data based on scientific, peer-reviewed methodology.
This way, you can rest assured that you will have the consistent data you need for your analyses, even when unexpected things happen!