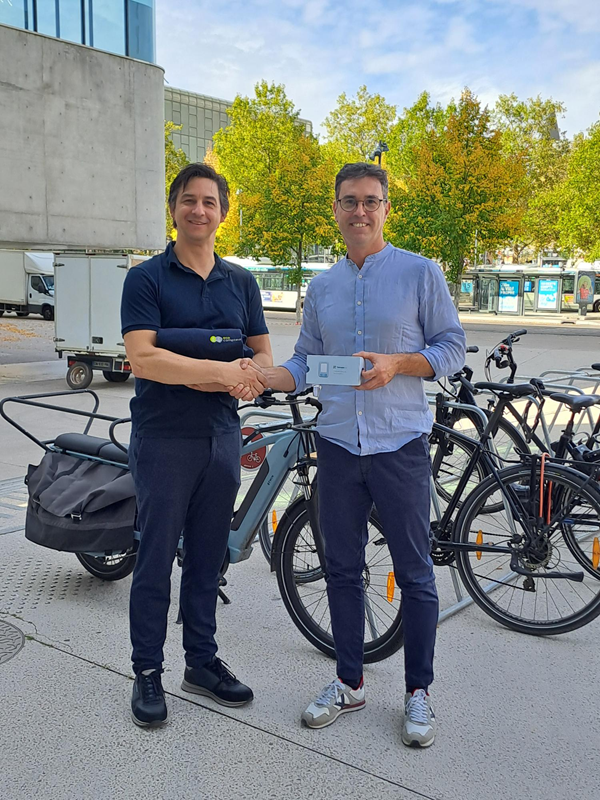
Velo-City 2026 Rimini: Our Lookback! International cycling event.
Find resources on the collection and analysis of count data for the developing active transportation, managing trails, and preserving natural areas.
Plus, discover case studies, data, and blog articles - enjoy your reading!

From Paris to New York, Japan to New Zealand, Eco-Counter solutions can be found in over fifty countries. Discover our case studies and examples of data collection around the world.

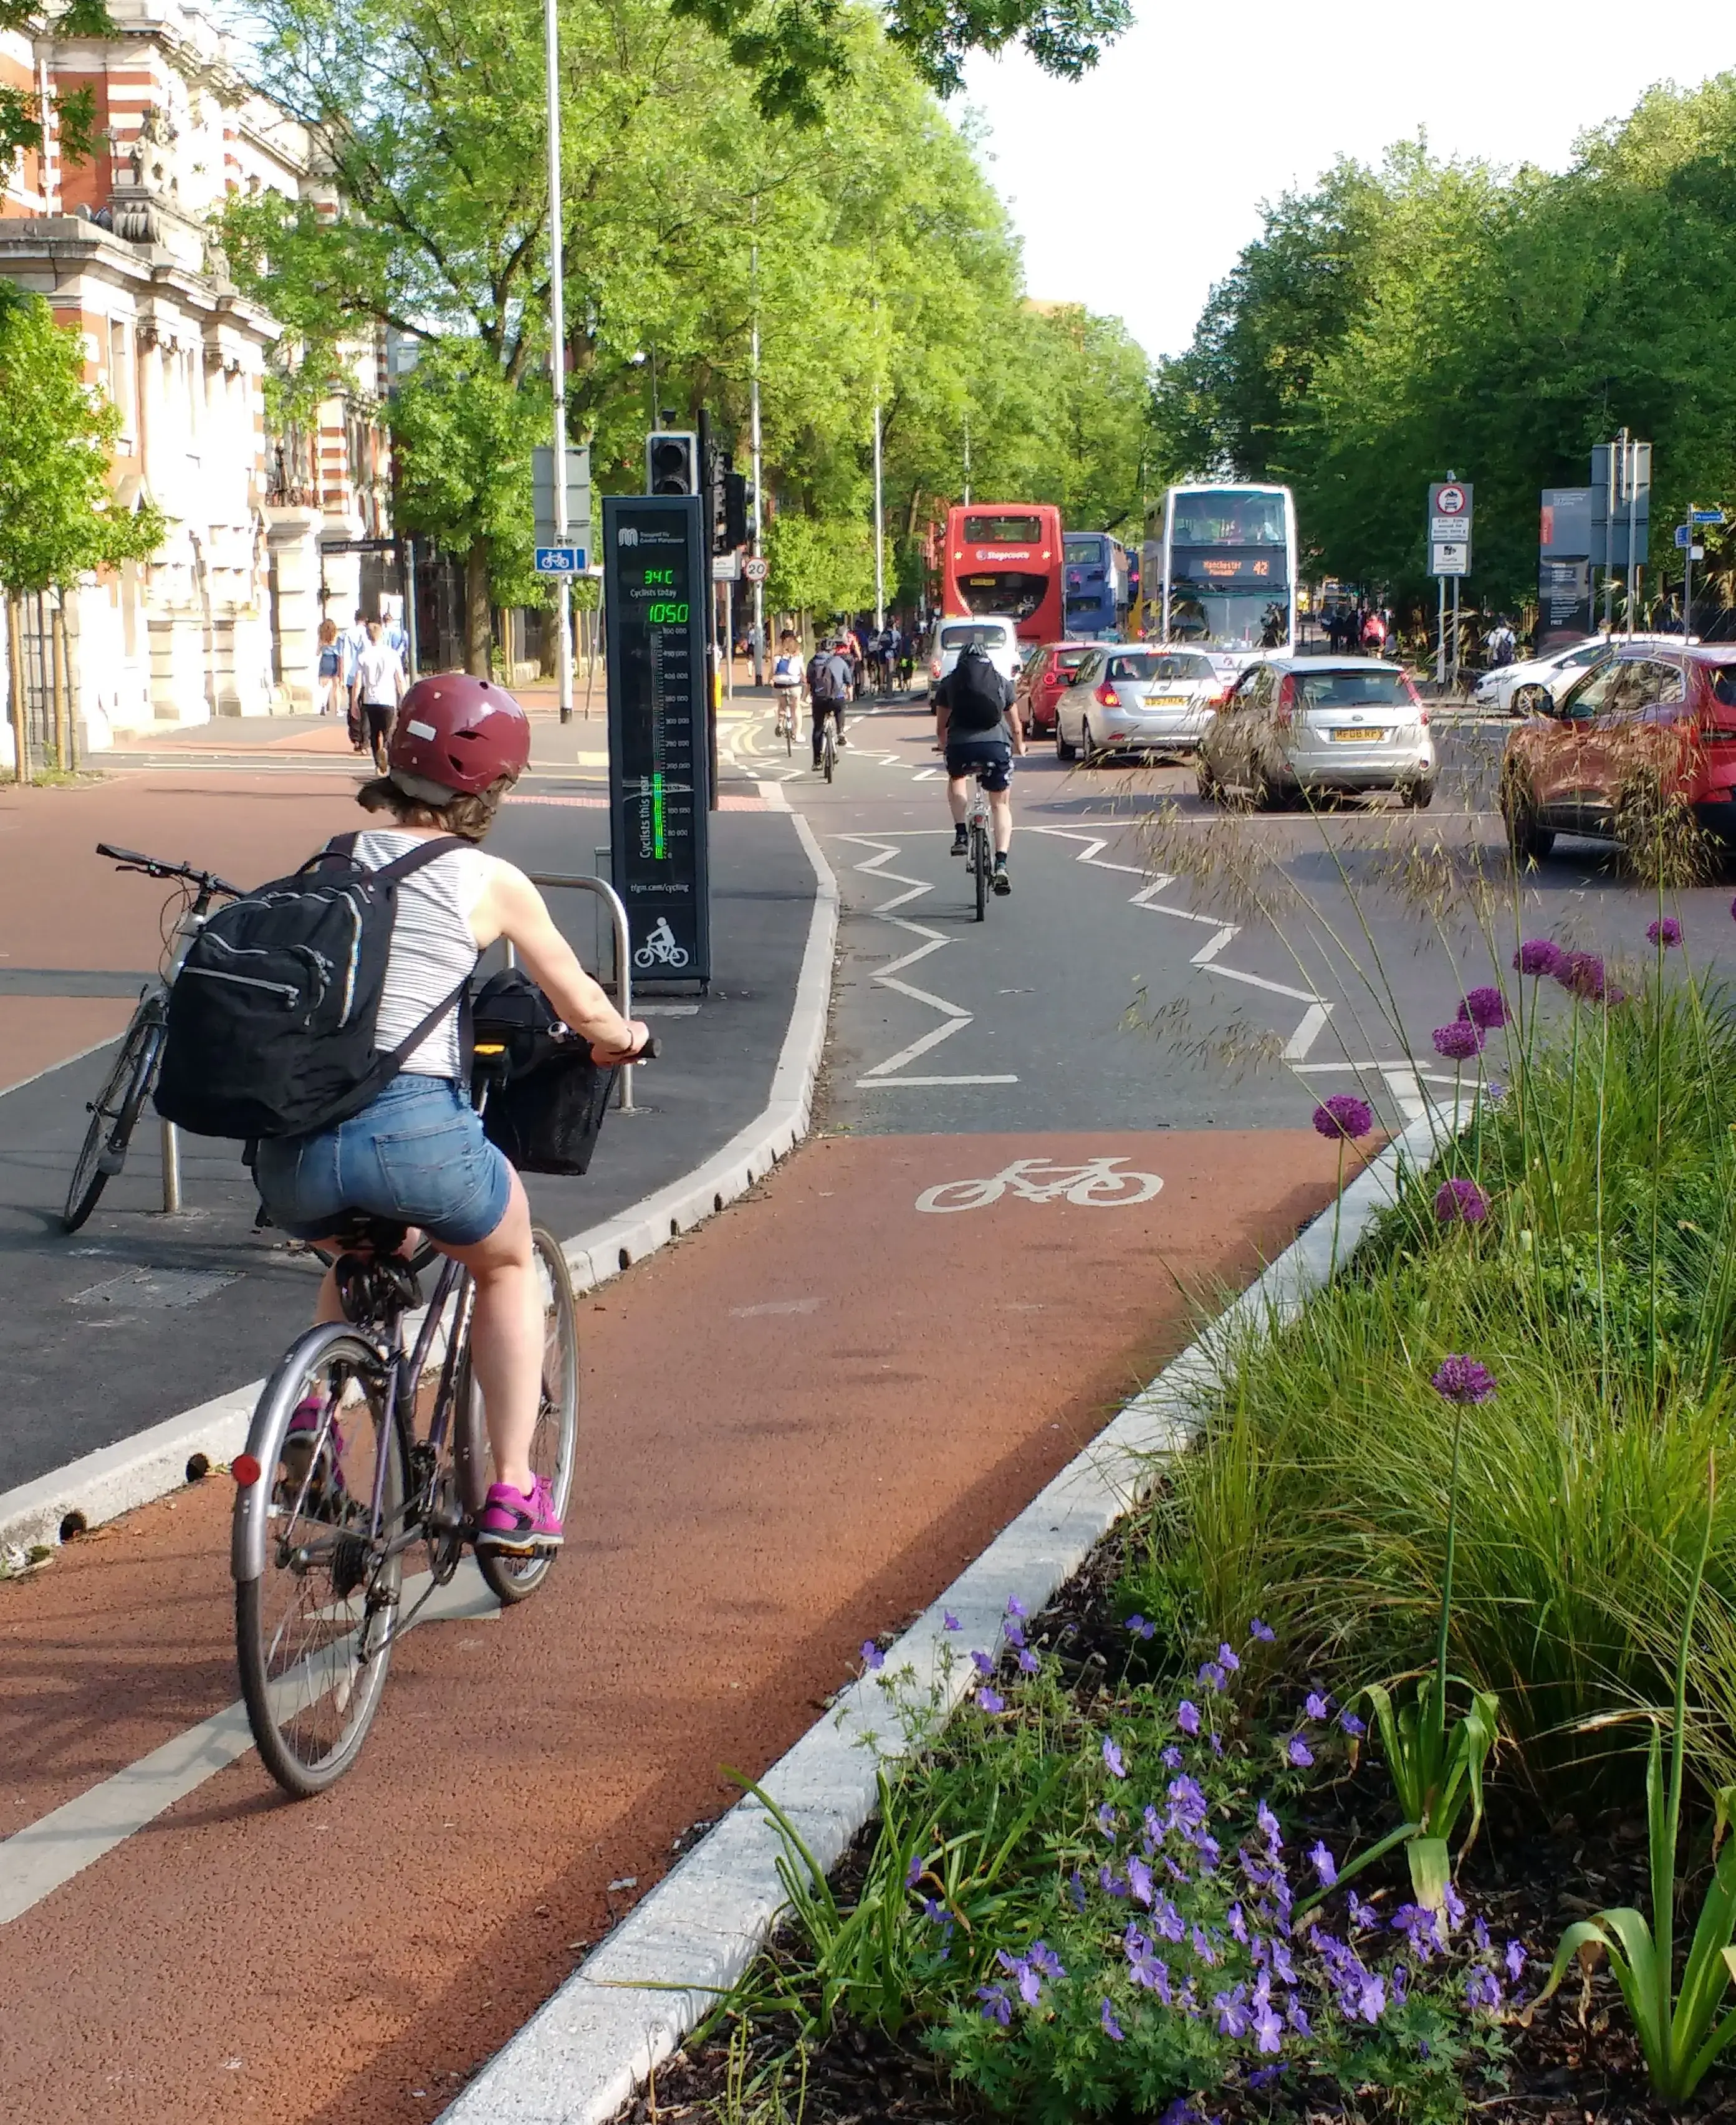
Over 500 worldwide Eco-DISPLAY counters count and display data in real time. Discover their latest counts on this world map!

Twice a year, we analyze bicycle ridership data from 14 countries – including 6 regions in the United States. We present the data in a dynamic dashboard that lets you explore trends by country, week, and year.

Count programs are often supported by external funding and grants, both private and public.
Here's our hand-picked list of funding opportunities in the United States and Canada that can support your count programs for active transportation, trails, and natural areas.

More and more organizations are opting to share their pedestrian and bicycle traffic data via Open Data.
Here's a constantly growing list of organizations that have made their count data public and available for analysis and exploration.
Read the latest on new products, count data use cases, FAQs, and more.
Velo-City 2026 Rimini: Our Lookback! International cycling event.
How Vision Zero Bike Count Data Helped Save a Bike Lane in Washington
What is the best cyclist counting solution for each environment?
Anticipate peaks using visitor traffic prediction: now in Eco-Visio!
Velo-city 2026: Eco-Counter’s agenda for the world cycling summit
City of Montreal and Eco-Counter to Collect Active Transportation Data
WAVIX-AI, non-intrusive radar to count bikes, pedestrians and vehicles
How Auckland optimises its cycling network by analysing ridership data
Measuring Visitor Traffic on the Trails of Boulder, Colorado