Published on Mar 31, 2026
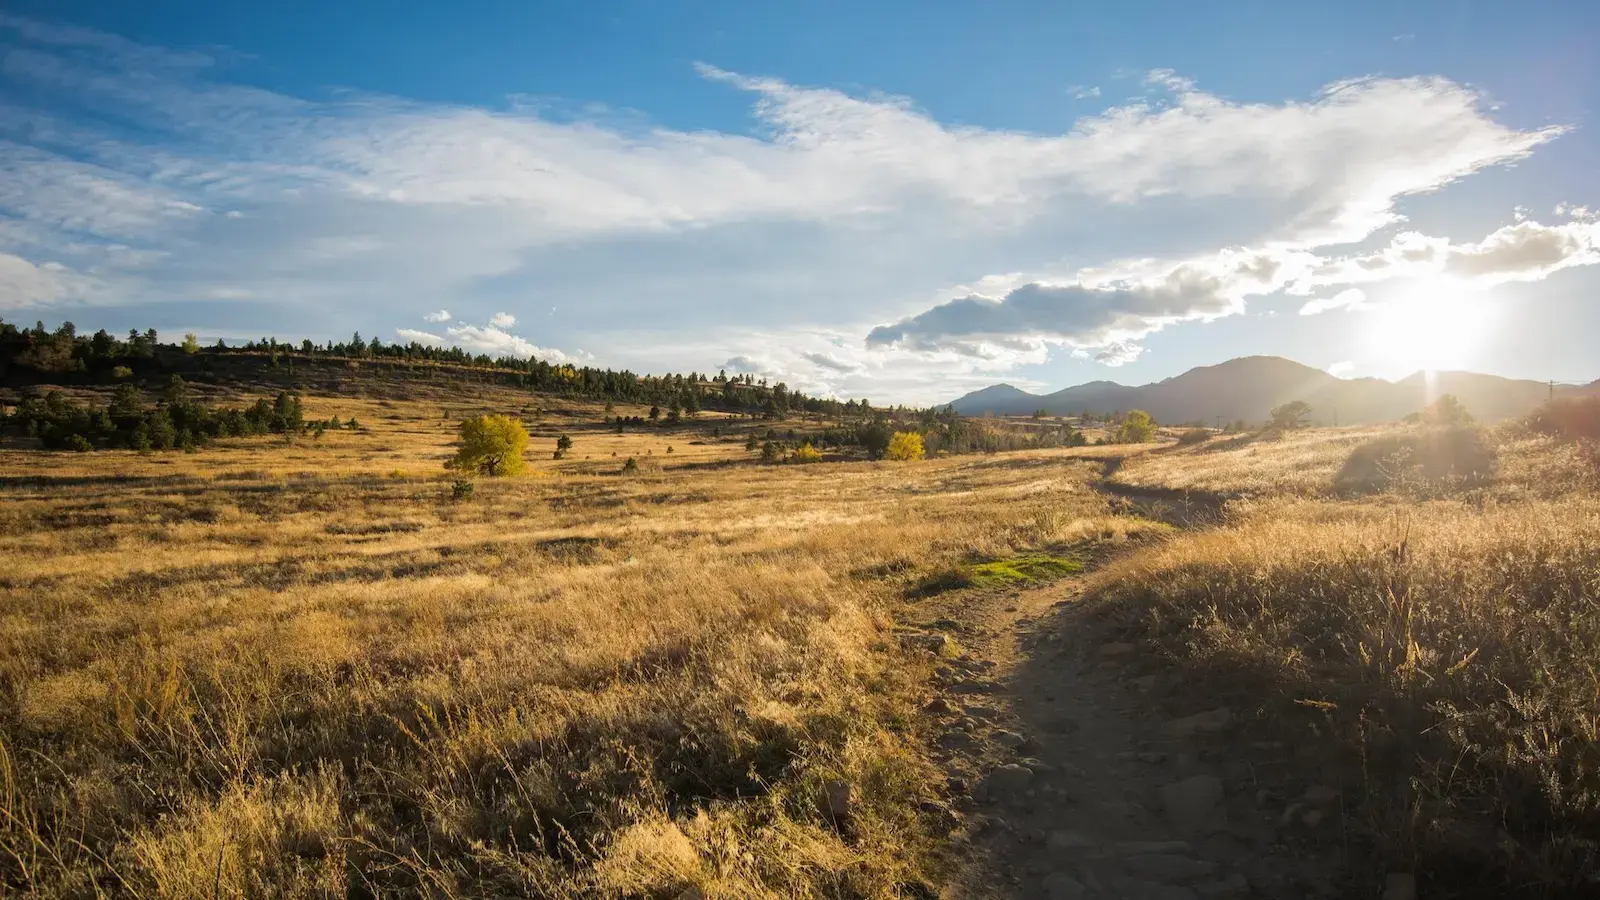
Measuring Visitor Traffic on the Trails of Boulder, Colorado
The City of Boulder is a beautiful mountain city with an active population. It has the highest active transportation mode share out of any city in Colorado. The people of Boulder treat walkways, ...
.webp)
_-_2022-01-16_-_7.webp)
.webp)