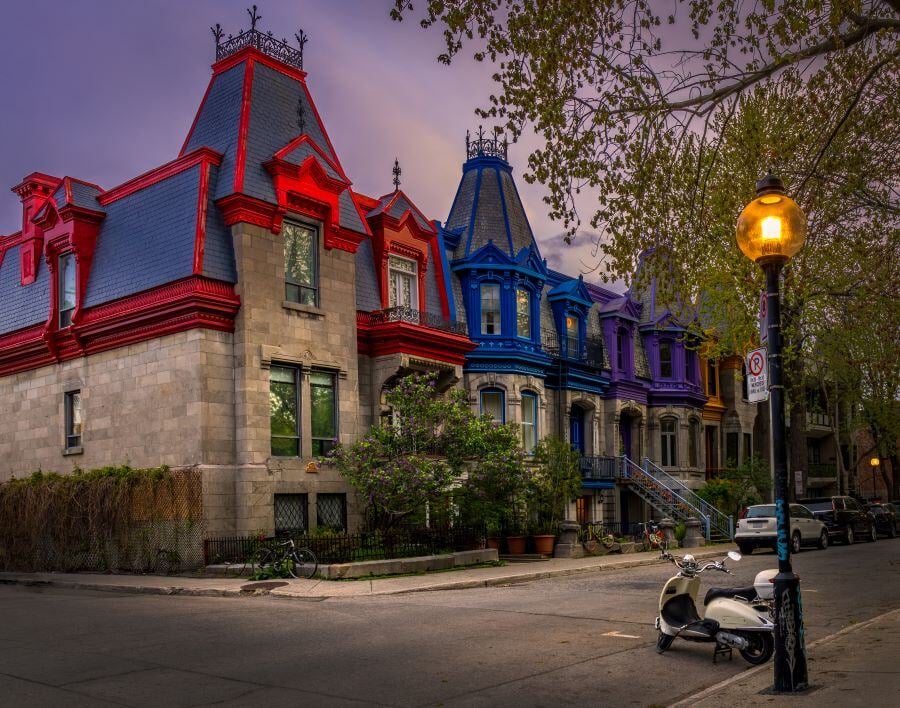
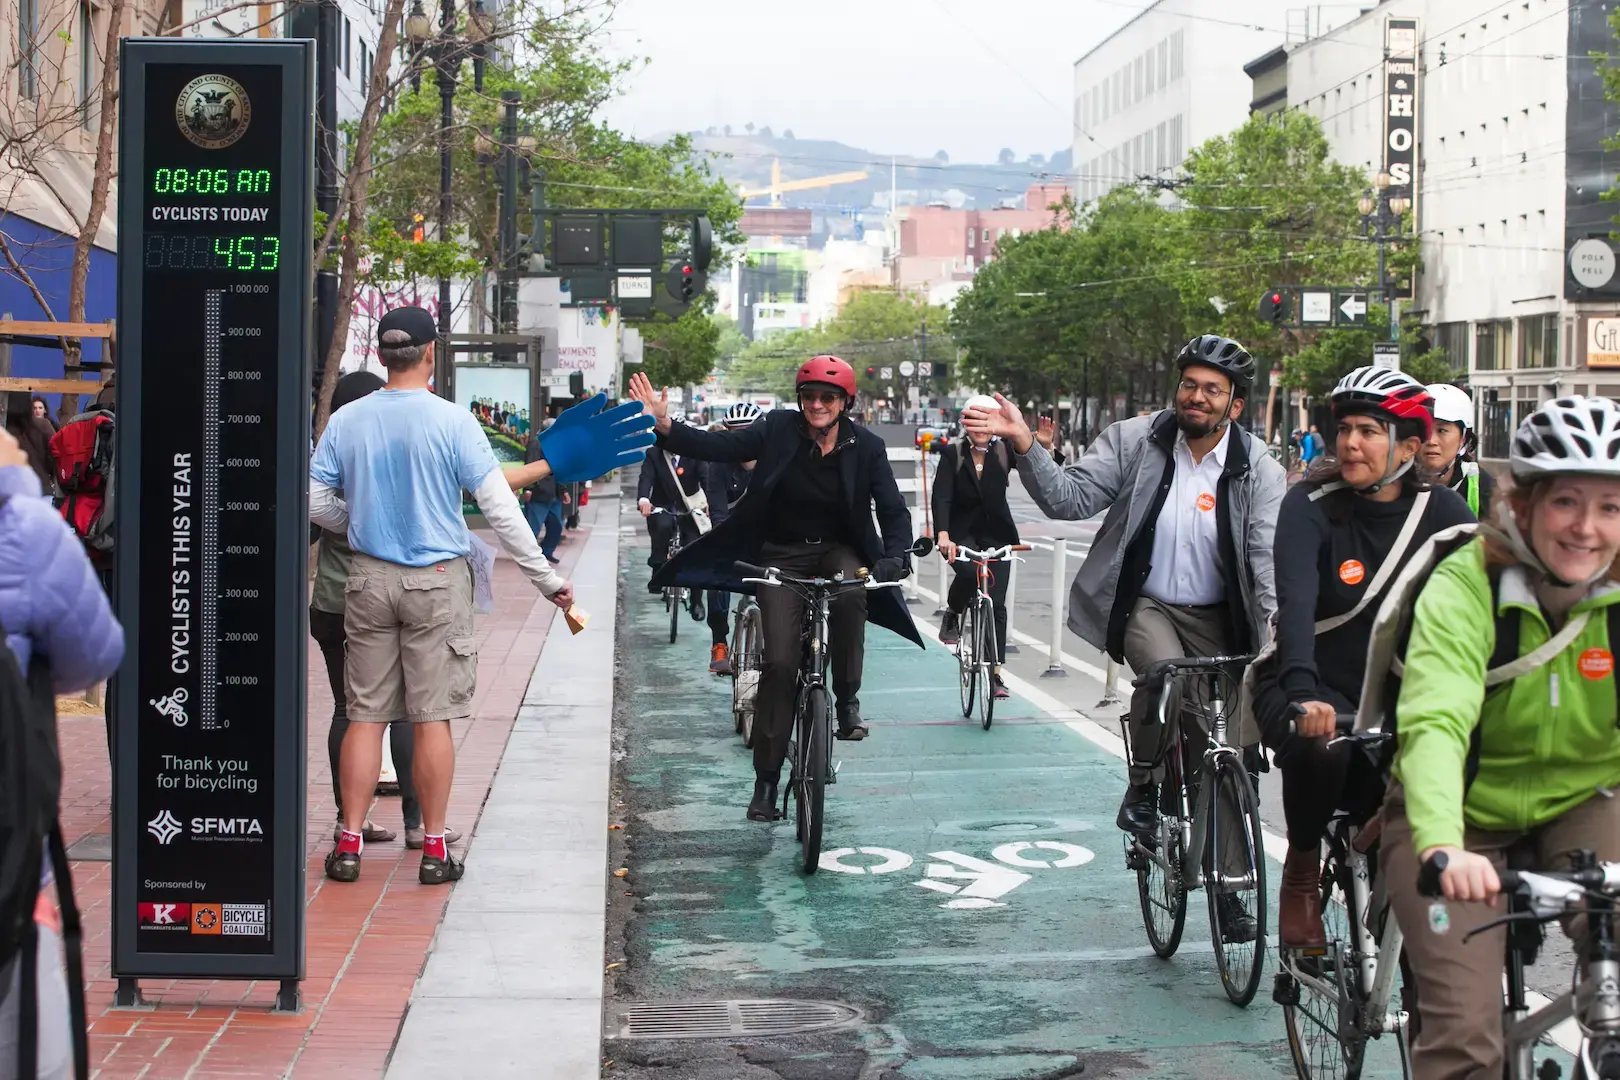
Modal share and space allocation

Modal share (or modal split) is the distribution of people using a mode of transportation or the percentage of trips for a mode. In active transportation, modes include walking, cycling, e-bikes, and e-scooters.

Knowing the modal share on your network helps you make important decisions about safety, space, and facility improvement to develop active transportation in your community.

Bikes and buses in the city

Are my streets designed fairly?

Designing active transportation facilities like pedestrian crossings and bike lanes is no easy task. However, much of it boils down to how public space is shared equitably between modes of transport:

    • How do people get around in my city today, and what is the modal share of bikes, cars, pedestrians, etc.?
    • Are my streets and layouts properly servicing the cyclists, pedestrians or motorists that use them?
    • Should cities be designed for the users we have today or those we would like to have tomorrow?

To get answers to these complex questions, reliable, ground-truth data is a valuable asset.

AdobeStock_295003295

How do I correctly design my pedestrian and bicycle facilities?

We offer a wide range of solutions to answer this question.

Analyze the spatial distribution of users

Multi-modal counters (such as our CITIX-AI Evo) can cover spacious intersections or areas with zone-by-zone analysis. These counters analyze infrastructure and deliver factual information on how you should size them.

In the example to the right, the study asks: "Is my crosswalk the right size?". The crosswalk is analyzed to identify the percentage of traffic that crosses outside the striped lines. If we observe that 5% walk outside the lines on weekdays and 15% on weekends, this is a strong signal to make this facility larger!

repartition-spatiale-passage-pieton

Measure the speed of cyclists, pedestrians, and vehicles

AdobeStock_348137922

Another important indicator for correctly allocating space and designing facilities is the measurement of speeds. By analyzing and comparing the speeds of pedestrians, cyclists, and motor vehicles, you can make key decisions about roadway design.

For example, speeds provide information to anticipate potential conflicts of use. The Federal Highway Administration even has a guide on how to design separated bike lanes if a roadway has higher speeds (30mph+). As another example, the European Cyclists' Federation has a guide that recommends the right radius of curvature for bike lanes at different speeds. Faster bicycle speeds mean wider curves are needed to prevent collisions between opposing flows.

Compare modal share with space allocation

One analysis that can reveal significant insights is to count different user types and compare their modal share with their allocated space.

On the right, for example, is a study we conducted in Montreal, Canada on a popular urban street.

Although we discovered that the modal share of bikes was over 30%, 0% of the street's space was allocated to cyclists. This inequity likely puts cyclists at a greater safety risk. More than that, the road had almost 50% pedestrian modal share, while the sidewalk took only 30% of the road's space. These two insights suggested that the road's space should be reallocated to favor bikes and pedestrians.

visuel4

Case study: Montreal

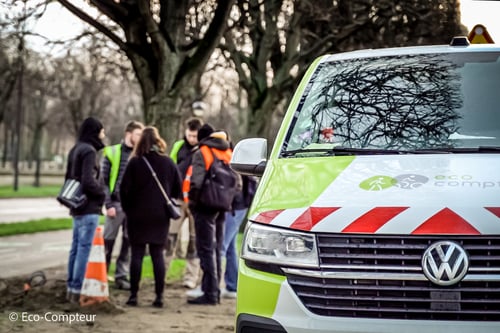
On behalf of the City of Montreal, Canada, we conducted a study in the Plateau Mont-Royal to measure the modal share of bicycles, cars, and pedestrians.

Based on two-week counts on several major arteries in the district, we extrapolated the Average Annual Daily Traffic (AADT) to produce a reliable annual estimate of overall traffic for the period and area studied. We also discovered the modal share of each user type: 56% vehicles, 32%  pedestrians, and 12% cyclists.

To study the equity between modal share and allocated physical space, we measured the space allocated to each mode on multiple streets, with surprising results.

AdobeStock_433147332

How Eco-Counter can help

eco_alouest_BD

Expertise

At every stage of your project (choosing count sites, selecting counting solutions, using analysis tools, etc.), our teams are here to help.

CAMS_INSTALL-2

Support

Already have a project in mind? Contact us and our dedicated support team will help you get it started from square one.

PWP_VUE_CARTO-3-1

Tools

Reliable hardware, user-friendly software, and guaranteed data quality: we provide a complete solution with products and services to get you the best possible data.

Frequently asked questions

What is modal share?

Modal share (or modal split) is the percentage of people using a particular mode of transportation or the number of trips that use that mode out of total trips. It is a key indicator for deciding on how to design active transportation facilities for walking, cycling, and more.

What is the recommended width of a bike lane in North America?

The Federal Highway Administration recommends that bike lanes be a minimum of 5 feet (1.5 meters) wide if against the curb or adjacent to a parking lane.

Of course, this guideline changes based on various factors. If a bike lane has high bicycle volumes or vehicle speeds, the recommended width becomes 6-7 feet (approx. 2 meters).

For a detailed guide, you can consult NACTO's Urban Bikeway Design Guide.

How much should a bike lane curve?

In general, how much a bike lane should curve is largely dependent on the speeds bikes are going. The faster the speeds, the larger the width and curve must be to allow cyclists to turn safely without crashing into each other.

Read more about it in this ECF guide.

Going further

Explore related topics and discover how data can be used in each situation:

Scooter and cyclist on bike path

Trend Monitoring

Usage and trend data measure the impacts of infrastructure projects and various factors on walking and cycling. Basing decisions on reliable data is the key to a safe city that prioritizes public health and fights climate change.

Bicycle barometer to communicate on the use of bicycles and walking

Communication

Communication with the public is a key part of active transportation development. Maximize the impact of communication campaigns using physical tools (roadside displays) and digital tools (data-sharing webpages) to show off your data.

AdobeStock_1086208897

Weather Impacts

The effects of the weather (rain, snow, heat, wind) on active modes are indisputable but often misunderstood. Analyze how weather causes behavior changes and make the right decisions about infrastructure maintenance.