- Home
- Developing active transportation
- Footfall data for urban redevelopment projects
Footfall data to add value to your urban redevelopment projects
Footfall data doesn't just measure flows: it tells the story of your projects and helps drive change with complete transparency. Whether you're launching a new bike path, sidewalk, or shared space, this data lets you show the before and after with clear figures and powerful visualizations. They become an invaluable tool for communicating with elected officials, partners, and the public, demonstrating the concrete impact of your choices.
For example a 30% increase in pedestrian traffic after implementing a traffic calmed street can become a key argument to reassure skeptics and enhance the value of the project. In this way, data transforms subjective debates into discussions based on objective evidence, facilitating buy-in from all the players involved.

How do you get people to accept urban transformations?
Urban redevelopment projects are often met with resistance or a lack of prioritization. Neutral, precise data is the best way to respond. By drawing on concrete examples, such as Vancouver's Burrard Bridge, where counts showed a significant increase in active users after the removal of a lane of car traffic, you can defuse fears and convince opposing parties.

Indicators to measure the impact of urban transformations
Data can be used to measure the real impact of transformations, providing an objective, relevant basis for communicating with key players and the general public.
Before/after traffic

Measuring changes in pedestrian and bicycle traffic before and after a redevelopment project provides concrete proof of the impact of your actions. This data helps answer a key question: has the project achieved its objectives?
A 40% increase in the number of pedestrians, for example, doesn't just validate your redevelopment choices—it becomes a strong argument to convince funders, elected representatives, and the general public. By comparing equivalent periods (before/after work, weekdays vs. weekends, traffic with comparable weather conditions), you can transform hypotheses into tangible proof.
Points of Interest

Points of Interest (POIs) are places where people take a break. Knowing where users stop, how long they stay and which places attract the most people means deciphering the DNA of your facilities. This information helps you refine your strategies: should you add benches, improve lighting, or rethink signage?
By identifying the most frequented points of interest and blind spots, you can optimize the user experience and maximize the appeal of your spaces.
Time spent walking

Beyond the number of passers-by, the time spent walking reveals the success of a redevelopment. Longer walking times or increased length of stay indicate that users are making the space their own, that they feel comfortable there, and that they are enjoying the change.
This often underestimated indicator measures the effectiveness of your choices in terms of comfort, safety, and ambience. It also differentiates between a simple "walk through" and a real usage of the space - a key criterion for projects aimed at creating user-friendly, sustainable spaces.
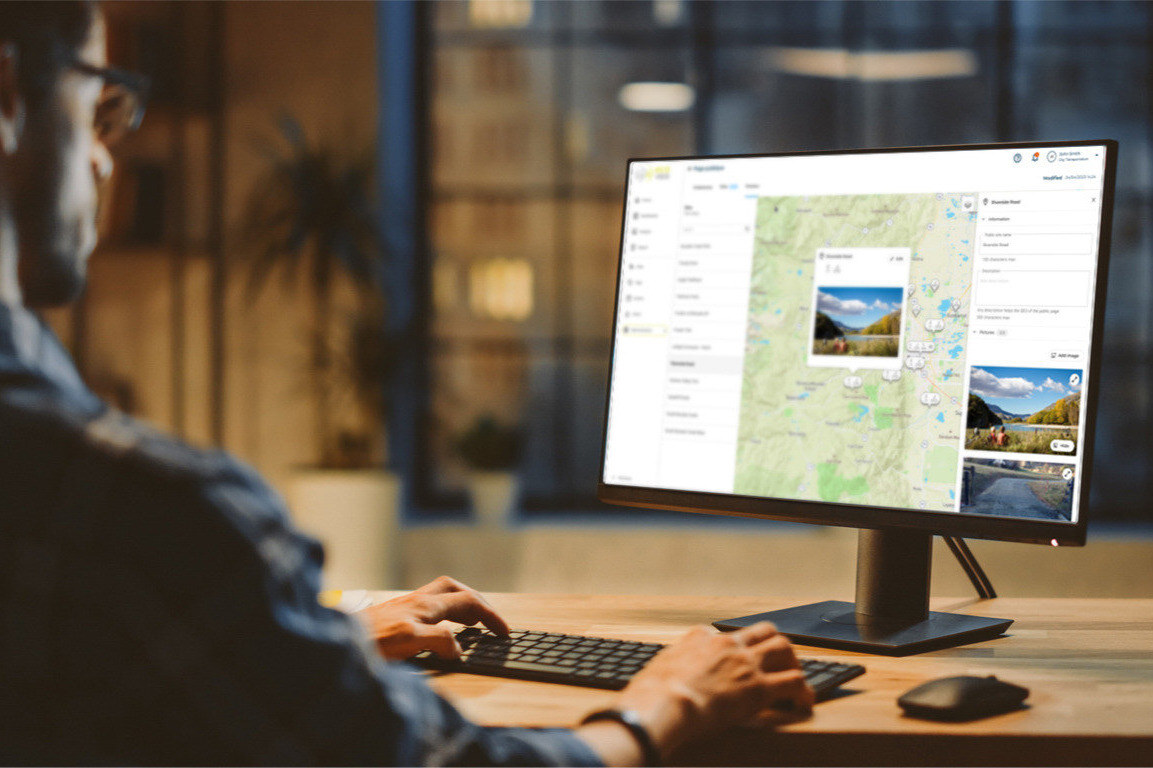
VisitorFlow, the solution for planning urban redevelopment projects
VisitorFlow is a unique solution offering a complete overview of pedestrian traffic in a given area. Using automated counting systems in the field and data from cell phones, it provides a detailed analysis of pedestrian flows, profiles and behaviors. As the seasons go by, you'll have access to objective quantitative and qualitative indicators to help you better understand your network, make it safer, and improve connectivity.
The cross-referencing of count data and mobile data or GPS tracks makes this a unique solution for providing a solid, long-term basis for all your decisions.


Urban redevelopment and footfall data on Saint-Denis Street, Montreal
Saint-Denis street, a historic north-south artery in Montreal, underwent a bold transformation in 2020 as part of the city’s Réseau Express Vélo (REV)—an ambitious 115 mile (185 km) protected bike network designed to boost cycling to 15% of modal share by 2027. The redesign prioritized pedestrians and cyclists, reallocating space from cars to create protected bike lanes, wider sidewalks, and green spaces, while preserving parking and limiting left turns to streamline traffic.
The results were striking: bicycle traffic surged by 248% and pedestrian traffic rose by 9% between 2018 and 2021. Car traffic dropped by 50%, with average speeds falling by 5 mph (8 km/h), creating a safer, more inviting environment. Economically, the street thrived: 37 new stores opened in 2021, pedestrian traffic jumped 65% from 2020 to 2021, and commercial occupancy climbed from 75% to 85% by 2023.
As Kriss Naveteur, CEO of the Saint-Denis Business Development Corporation, noted: “This project proves that prioritizing people over cars doesn’t harm business—it revitalizes it. By making the street safer and more vibrant, we’ve attracted new visitors, workers, and residents, transforming Saint-Denis into a destination.”


How we help
Expertise
At every stage of your project (choice of counting site, appropriate technologies, analysis models, etc.), our teams do their utmost to help you manage your parks & gardens!
Support
Do you already have a project in mind for which visitor or usage data could be useful? Contact us to discuss your project!
Tools
Robust, reliable hardware, ergonomic software, data quality: we provide a complete solution that includes products and services to enable you to obtain the best possible data.
Going further
Would you like to explore topics related to parks & gardens management? Discover how data can help you address these other issues.
.webp?width=1500&height=1000&name=AdobeStock_496911858%20(1).webp)
Monitoring active transportation trends
Usage and trend data measure the impacts of infrastructure projects and other factors on walking and cycling. Basing decisions on reliable data is the key to a safe city that prioritizes public health and fights climate change.

Safety for cyclists & pedestrians
Vision Zero is an international traffic safety project that aims to eliminate deaths or serious injuries on road networks. This initiative calls for specific data on vulnerable road users such as pedestrians and cyclists.

Weather impacts on walking & cycling
Weather often has significant and unexpected effects on urban mobility. Understanding the behaviors caused by each weather condition can greatly improve planning and resource management.
How can I justify urban transformations?
To reduce conflicts of use and gain acceptance for urban transformation projects, footfall and usage data are a powerful tool for dispassionate debate and getting back to the facts.
With Eco-Visio's data analysis software, you can create impactful visuals in just a few clicks, to convince the public and partners, and add value to your redevelopment projects.
Are bicycle lanes or pedestrianization good for business?
A number of recent examples and independent studies show that reducing car use in favor of calmer urban spaces and active mobility (walking or cycling) has a predominantly positive effect on shops.
As in the example on Saint Denis Street in Montreal, the data actually shows an increase in overall footfall, a rise in retail activity, and a fall in business vacancy. While each project is different, one thing is certain: footfall data is an important tool for measuring the impact of retail transformation projects. Sharing this data with the players involved (retailers, associations, technicians, elected representatives) also helps to reassure and gain acceptance for the transformation projects.