In the first article of this series, we’ll go over the basics of big data and automated counters. More specifically, what they are, why they matter, how they work.
Automated counters: An overview
For decades, automated counters have been a hallmark technology in helping transportation professionals get reliable information about their roadway networks.
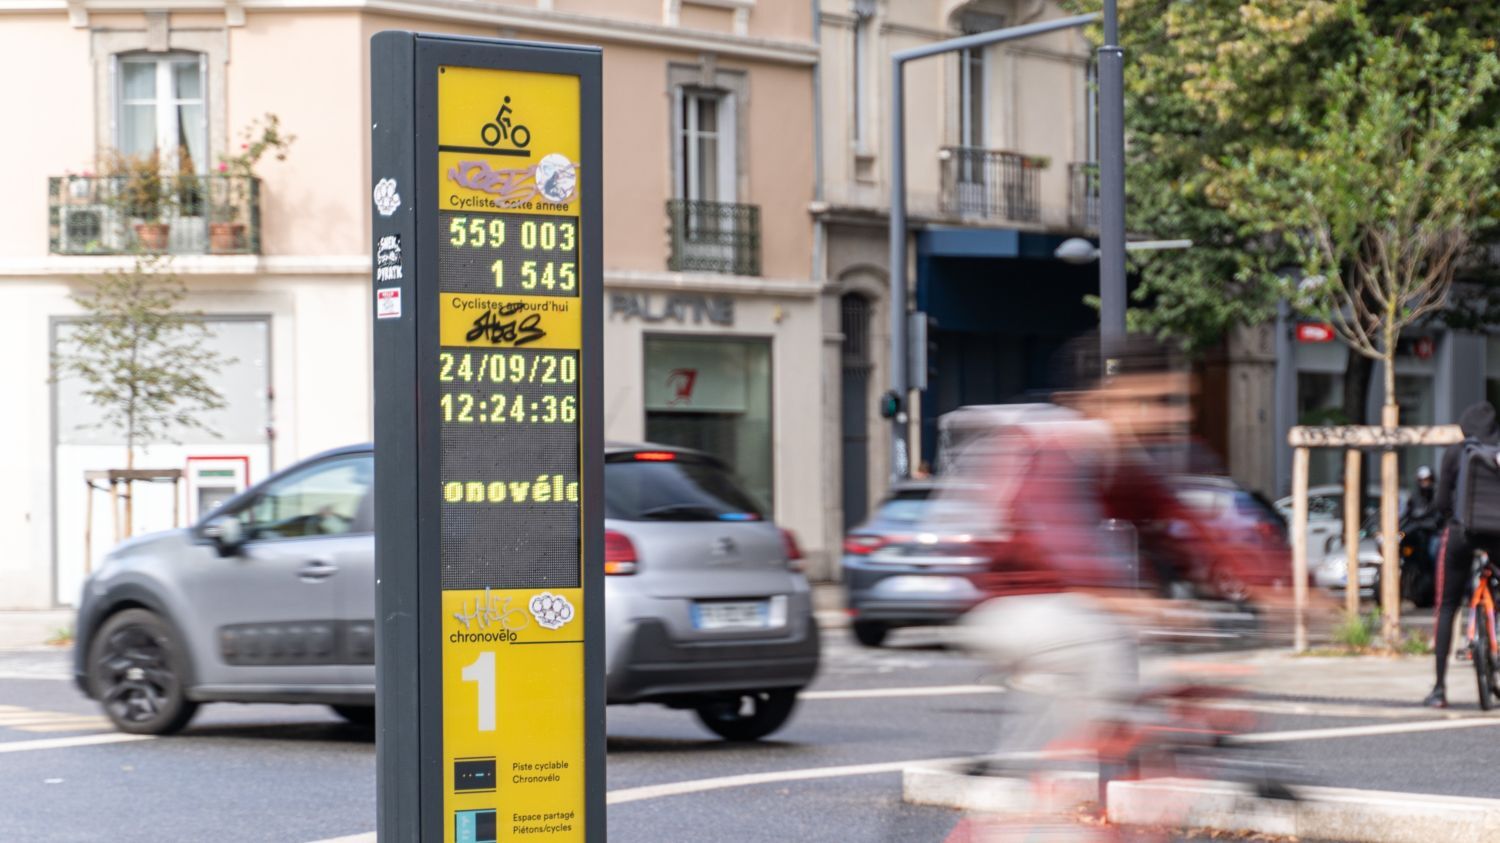
Today, you’ll see automated bike and pedestrian counters all over the world collecting continuous year-round data, helping make roads better and safer without putting a massive strain on resources.
How do they work?
There are many types of ped and bike counters, so we’ll focus here on the what we know best. (For more info on counting technologies, see the appendix of this great, albeit slightly dated, report from the U.S. DOT.)

- Pedestrian counters: One method of counting pedestrians on a sidewalk or path is to use passive infrared technology.
- The infrared beam, invisible to the human eye, detects the difference in temperature between the surrounding environment and body heat of people passing by to generate counts.

- Bicycle counters: Two technologies to count cyclists are pneumatic tubes and inductive loops.
- Pneumatic tubes are rubber tubes that detect the change in air pressure of a bike passing over them to register counts. Inductive loops are sensors placed underground that sense the metal of a bike to count them as they ride over.

- Combined pedestrian and cyclist counters: Oftentimes both pedestrians and cyclists need to be counted on a single shared facility.
- In these cases, pedestrian and bicycle counting technologies can be merged into an all-in-one solution. In our case, infrared sensors, inductive loops, or pneumatic tubes count and communicate with each other simultaneously to distinguish between different user groups.
Automated pedestrian and bicycle counters have existed since the early 2000’s and have come a long way. In today’s landscape, counters have evolved to include functionalities like direction detection, differentiating bikes and scooters, speed measurement, etc.
Beyond this, there are now counters that use video technology and artificial intelligence (like our CITIX-AI) to count and differentiate user groups. These can include two-wheeled vehicles, cars, trucks, buses, and more. These incredible technologies deserve their own spotlight and will be covered in a future article.
Use cases
If you’ve worked in active transportation, it might be clear why automated counters and the data they provide are important. Nonetheless, here are five primary use cases for automated counters and count data:
- To identify infrastructure usage trends to allocate resources and prioritize investments.
- To measure the impact of transportation public policy decisions.
- To present active transportation data to the public and demonstrate commitment to mobility options.
- To conduct before and after studies and quantify the success of new projects or initiatives.
- To monitor changes in mode shift, evaluate safety concerns, and adapt strategies accordingly.
What are their main advantages?

As a method of collecting data for active transportation, automated counters have various advantages. The key ones are as follows.
Advantage #1: Ground-truth
As a technology that operates “in the field”, counters are a vital source of ground-truth data. This means that they provide the baseline for many other types of data analysis and are one of the most accurate depictions of what’s truly happening at the ground-level.
Advantage #2: Data anonymity
Due to the nature of the technology, automated counters gather anonymous data that can’t be traced back to an individual. This makes them a great solution when it comes to privacy concerns.
Advantage #3: Bias reduction
Because they count all users passing by, automated counters are free from biases that may exist in other sources of data. For example, a skew towards more of a certain age range, activity, or socioeconomic status.
Advantage #4: Data shareability
Automated counters provide data that is easy to understand and communicate. Added with its ability to gather great volumes of continuous data over time, they allow for effective storytelling and generate studies with transparent methodology that the public can easily comprehend.
Big data in active transportation: An overview
While count data gives solid insights, today’s planners also want to know: Where are people coming from and where are they going? Which facilities are they using? Where are there more collisions than there should be? Is my network accessible enough?
That’s where big data comes in. Big data can have many definitions, but often refers to large and complex datasets that are generated from various sources at high speed and volume.
Planners, governments, and organizations alike can use big data sources to obtain insights that previously hadn’t been possible to obtain- and use them to make large decisions for their networks.
Where does it come from?

Individuals and agencies that want to use big data for active transportation planning can do so through companies that specialize in this field. Each company provides different data, offerings, and analyses, but most companies get their raw data from a few common sources:
- GPS data from cycling or jogging apps
- Location-based services data from smartphones or mobile devices
- GPS and demographic data from ride-share systems
- Demographic data from telecommunications companies
- Open-source data from surveys, social media, etc.
What are its advantages?
Big data has great potential for the advancement of active transportation planning because it can help paint a more holistic picture of networks and regions at a macro level. Using this detailed information on the behavior and preferences of active travelers, planners can improve their demand forecasting, mode choice modeling, network analysis, and performance evaluations.
Common examples of information you could gain from big data include:
- Origin-destination data
- User demographics
- Hotspots and isochrones
- Mode shift
- Desire lines
- Slow zones
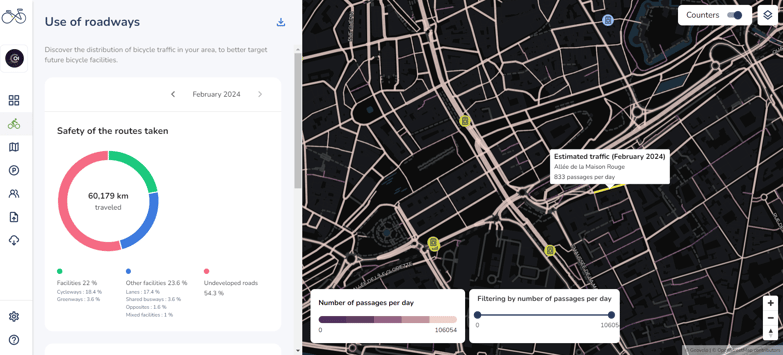
Example of network analysis in Cycling Insights.
Big data’s key advantages for active transportation planning:
-
Due to the volume and variety of its sources, big data has a richness and reach that is unparalleled by other data sources.
-
Big data can detect and illustrate trends with relative ease on a huge scale, like at a city or county level.
-
Since it uses historic data, big data can help quickly make predictions from past trends, making it useful for time-sensitive studies and projects.
What are its drawbacks?
While this technology offers a wealth of benefits, it’s not without its drawbacks.
To end the first article in this series, let’s explore some of the potential challenges and drawbacks associated with using big data in active transportation.
Drawback #1: Digital divide and data biases
Relying on big data can exclude individuals or communities that lack access to technology or choose not to buy items like smartphones. As well, users of cycling or jogging apps tend to represent only a small demographic of active transportation users (e.g., only leisure cyclists and not commuters). This can result in a biased representation of transportation patterns and hinder efforts to create an inclusive network.
Drawback #2: Data privacy concerns
Collecting and analyzing vast amounts of data, especially when it involves individuals and their behaviors, raises concerns about data privacy. Protecting the anonymity and personal information of users is a critical consideration. On a case-by-case basis, big data providers might not be able to meet privacy standards in their offerings across regions and borders.
Drawback #3: Data quality and availability
Big data is only as valuable as the quality of the data it relies on. It can often be challenging for big data to draw conclusions about low-volume infrastructure types/neighborhoods due to the lack of continuity of data points. In addition, the availability and quality of data can fluctuate depending on sources, privacy legislation, or providers. Without continuous, accurate data at the ground level, big data can lose its footing. This potentially leads to inaccurate insights and misguided planning decisions.
Conclusion
With these limitations in mind, it’s important to understand that big data is only a part of the equation- not the full solution.
Now that we’ve gone over the foundation of automated counters and big data in active transportation planning, read our next article to see what your next step is as a practitioner. Namely, learn why combining the two sources is the key to a true, balanced, and effective understanding of active transportation networks.