The two winners of the first-ever Bikes Count competition are the City of Charlottesville (VA) in Virginia and Treasure Valley Cycling Alliance (TVCA) in Boise, Idaho! Throughout the summer, we have been supporting Charlottesville and TVCA to get the most out of their cycling data and to use those insights for meaningful, bike friendly change in their community.
Over the next two blog posts, we are going to dig into each winner’s story and the data that makes an impact in their biking movement. Today, we start with Treasure Valley Cycling Alliance.

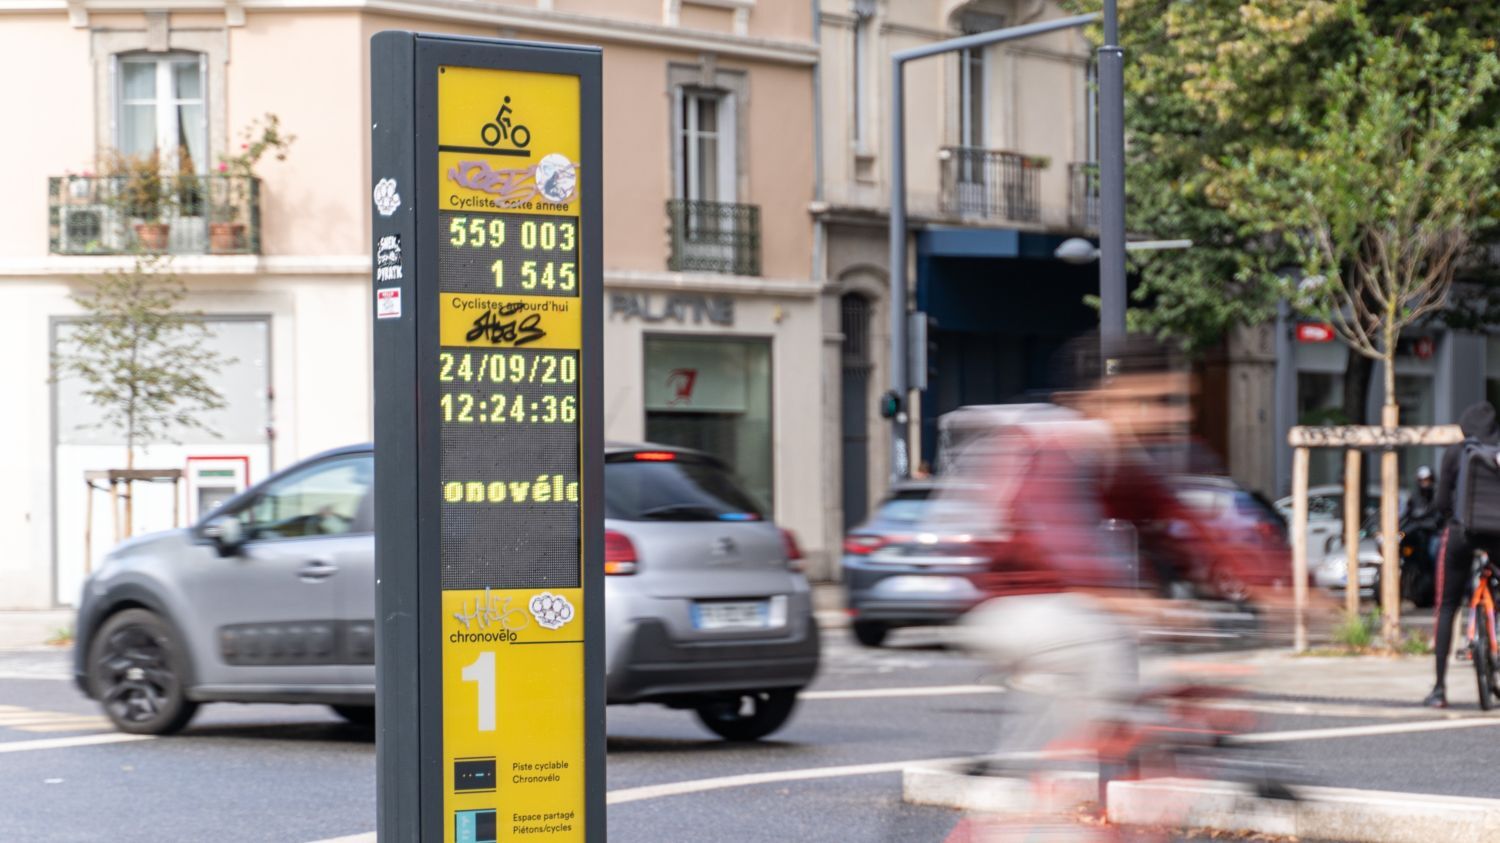
If you don’t count, it doesn’t count
Treasure Valley Cycling Alliance is a non-profit membership organization of volunteers working to promote bicycling and improve transportation infrastructure for bicycles in Idaho’s Treasure Valley. Since 2007, TVCA has conducted manual counts of cyclists twice a year in September and May using the intersection turn counting methodology. Counts have been conducted at over 140 locations during commuter times (7-9am and 4-6pm), totaling nearly 37,000 bikes counted.
A core goal of the TVCA manual count program is to leverage the data to help local agencies – notably the highway district and city – to make better bike infrastructure decisions in communities that do not have them. Despite having more than 14 years of counts, the data, however, wasn’t making as much of an impact as they would have liked. TVCA lacked the skill and volunteer resource capacity to sort, analyze and communicate the data. That’s where the Bikes Count grant came in…

Volunteers use this manual count sheet when doing counts, just one of many resources available from TVCA
After an initial handover session, our dedicated data services team dug into 14 year’s of TVCA manual count data and began the cleaning and analysis process. TVCA was particularly interested in capturing trends over time, understanding the spatial distribution of cyclists across the city, and having some tools to communicate the growth of cycling.
Manual counts, automated counts and data extrapolation
With so many count locations around the city, TVCA are unable to count at the same location every year, providing significant challenges for year-on-year data comparisons. To compensate for these gaps, our data services team applied data extrapolation: the process of calculating seasonal bike and pedestrian volumes from short-term count studies using cluster analysis. Manual count data was correlated with nearby data from automated bike count stations to build our data extrapolation model and inform annual average daily traffic (AADT) estimations.

AADT analysis from data extrapolation proved what cyclists in Boise already know well: bicyclcing is booming in Boise. These AADT counts at many intersections are higher than in a similarly sized comparable city, with 6 intersections recording an AADT greater than 1,000.
Cyclists are also well distributed around the network, with particularly significant cycling taking place on the city’s east-west Greenbelt protected infrastructure along the Boise River. Going one step further, our team then overlay the AADT data (2007-2020) with GIS mapping to visualize counts and cyclist route preference.

Capturing growth over time
One of the principle reasons organizations of all sizes chose to collect count data is to understand the growth of cycling over time – often one simple, singular data point to prove all the hard work is worth it. Our team dug into the data to extract year-on-year growth trends, breaking the anaylses into year buckets for study. First, let’s look at the change from 2007 to 2015. During this time, a significant growth in cycling took place in Boise. 5 intersections saw a more than 50% growth in cycling volumes (AADT), with the top ten highest growing intersections all seeing +45% growth.

During the full study period 2007-2019, significant growth was also seen elsewhere in the network, with the 10th & Babcock intersection seeing 70% growth in volumes and Cloverdale & McMillan seeing 61%, along other contenders.
What else did we learn about cycling in Boise?
To inform advocacy efforts and local policymaking, our team also extracted a few additional high-level takeaways for TVCA:
- As was the case elsewhere, the pandemic dramatically reduced bike counts during the spring of 2020;
-
With some of the highest overall counts, the Greenbelt is an important commuting axis for Boise cyclists;
-
There is a need for weekend data collection to better distinguish commuting vs. recreation trends.
All of these trends, takeaways, data visualizations and best practices were shared with TVCA in a final congratulatory handover session.
We are so proud to have worked with Treasure Valley Cycling Alliance this summer to deliver their Bikes Count grant and hope that this data will support their hard work fighting for a more Bike Friendly Boise. A special thanks to The League of American Bicyclists for their work, in addition to The Community Planning Association of Southwest Idaho (COMPASS) for all of their support.
Stay tuned to this blog for part 2 of the Bikes Count series to discover cycling data in The City of Charlottesville and their snazzy infographic…
Want to learn more?
- Check out our webinar recording ‘How to Make Your Bike Data Count’ with The League from this summer, where planners from TVCA and Charlottesville shared their projects. You will also learn best-practices for applying and using count data from Eco-Counter’s very own Andrea Shillolo.
- Discover best-practices for developing a manual count program via great free resources from the Treasure Valley Cycling Alliance.