Breathing new life into an automated count program
Charlottesville (VA) is a medium-sized city of 50,000, located 100 miles southwest of Washington DC. Home to the University of Virginia’s 17,000 students, the city has particular transportation needs and an increasing network of separated and on-street cycling infrastructure. An active city, nearly 25% of commuters walk, cycle or take public transit. Since spring 2015, the city has collected data on cycling volumes using seven permanent Eco-Counters – including our ZELT bike counter – at six different locations around the city.
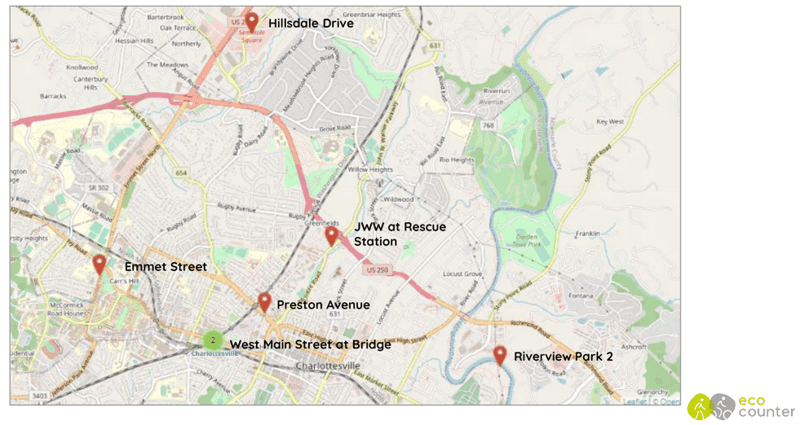
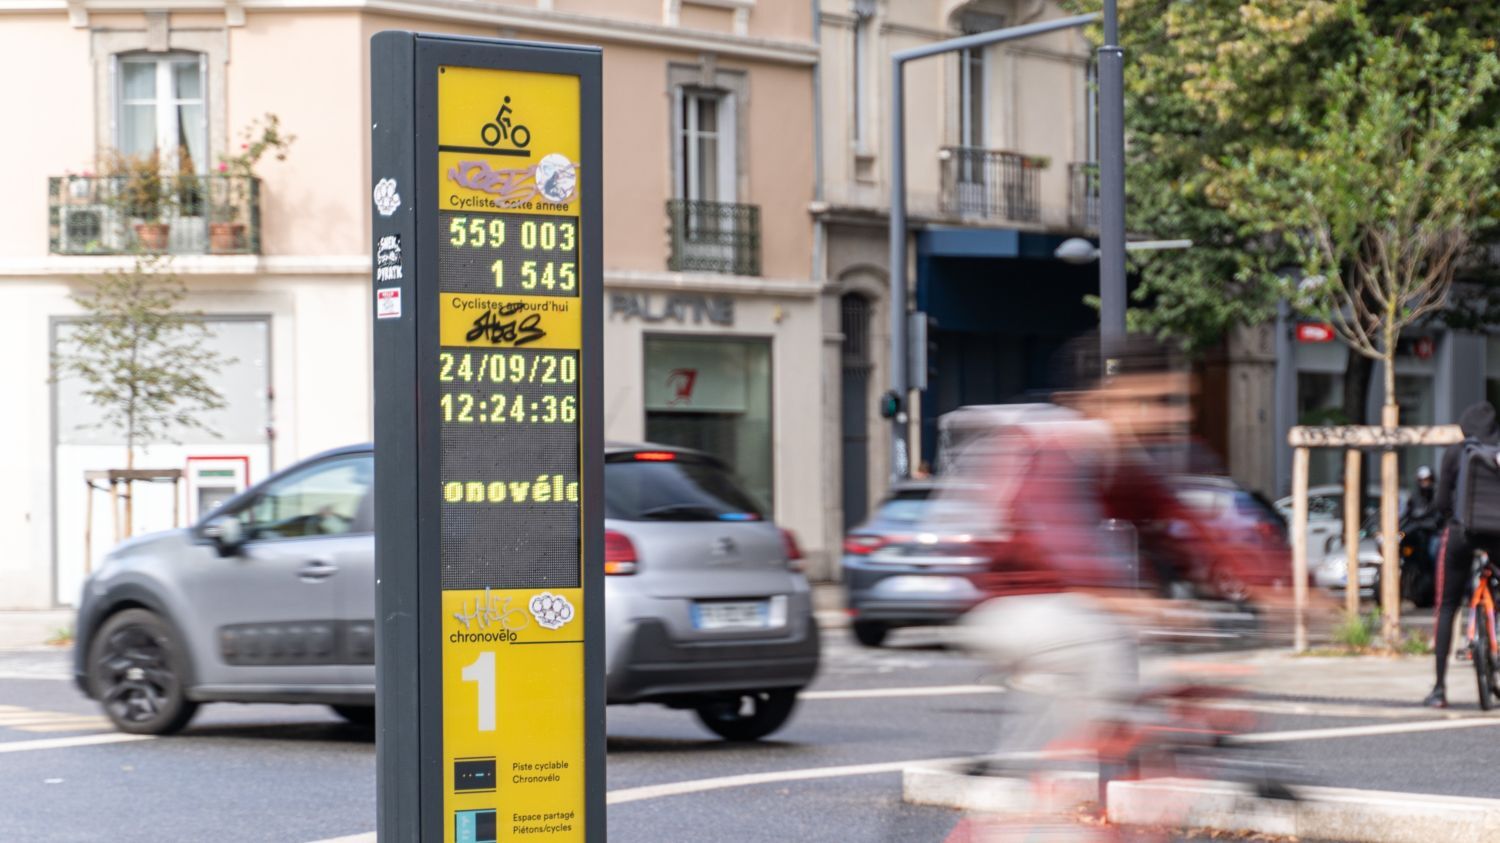
Permanent automated bike counters are spread around the city on mixed-use trails, on-street and dedicated cycling infrastructure.
Despite six years of continuous bike count data collection – actively shared with the Virginia Department of Transportation – in addition to annual manual count initiatives, city staff have struggled to put the data to good use due to resource constraints. In applying for the grant, bike planners aimed to:
-
-
Understand travel trends over time
-
Understand the impacts of current/future infrastructure improvements
-
Have access to data that clean and reliable for public sharing
-
Regularly present findings to interested stakeholders, staff, elected officials, and the general public
-
Visualizing bike count trends over time
With these needs in mind, combined with a few brainstorming calls with local bike planners and our data services team, we set about cleaning, analyzing and presenting their data.
First, looking at the most recent full fair-weather season of cycling data (here defined as April 1st 2020 to October 31st 2020) we are able to get a baseline understanding of daily average bike counts across the network.
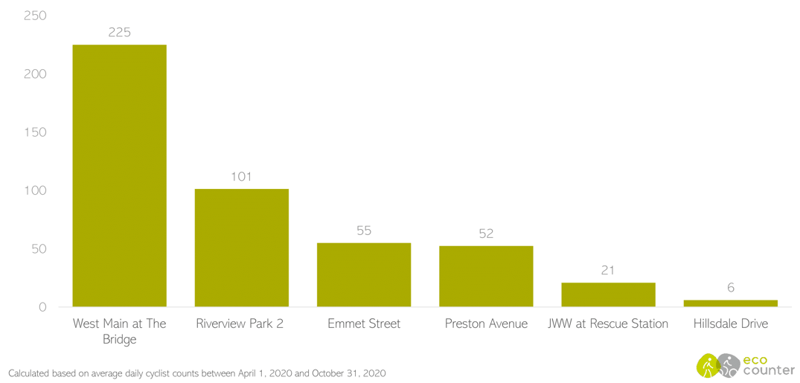
The 2020 cycling season: daily average bike counts in Charlottesville.
With an average of 225 bikes counted per day, West Main Street at The Bridge leads cycling volumes across Charlottesville’s network. This counter is excellently placed to capture statistically significant trends as it is centrally located and on a principal thoroughfare, almost representing a funnel point in the network.
Isolating just this counting site alone and plotting average weekly counts on the Y axis, five years of data tell an interesting story.
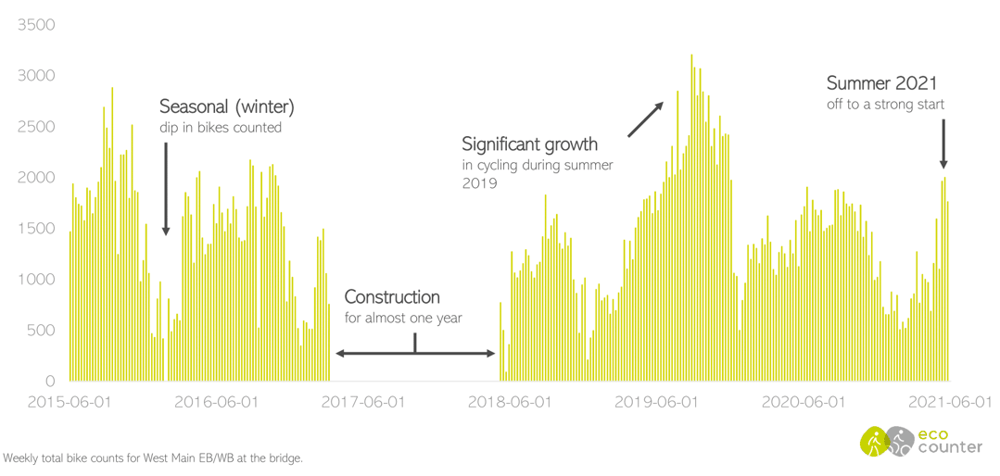
Cycling over the years: 2015 to 2021 weekly bike counts on West Main Street at The Bridge in Charlottesville (VA).
At this level, we can clearly see the seasonal cycling trends. During the harshest winter months, average weekly volumes fall by around 50% vs. summer averages, before bouncing right back in the spring. Between 2017 and 2018, no bike count volumes were collected due to a significant construction project along the route, before spiking to new, sustained highs in 2019 and then dipping back down in 2020 during the pandemic.
West Main Street at the bridge – cycling over the years.
Understanding the impact of the pandemic on cycling in Charlottesville
As we have seen in many places in the past year and a half, with work from home and business closures, the pandemic impacted daily cycling trends. In 2019, before the pandemic for example, weekly cycling followed a fairly standard profile in Charlottesville, with rush hour peaks during the week, followed by more spread out activity at the weekend.
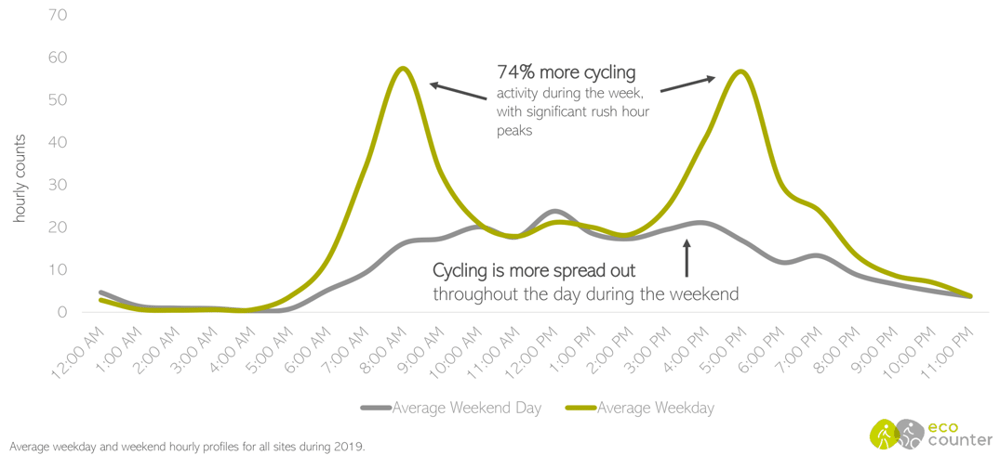
Before the pandemic: average weekday vs. weekend daily cycling trends in Charlottesville.
Trends in 2020, however, were very different. The weekday morning rush hour peak halved and the afternoon peak was less significant. In fact, for much of the day, average hourly counts during the weekend were higher than during the same period in the week, a major reversal from the year before.
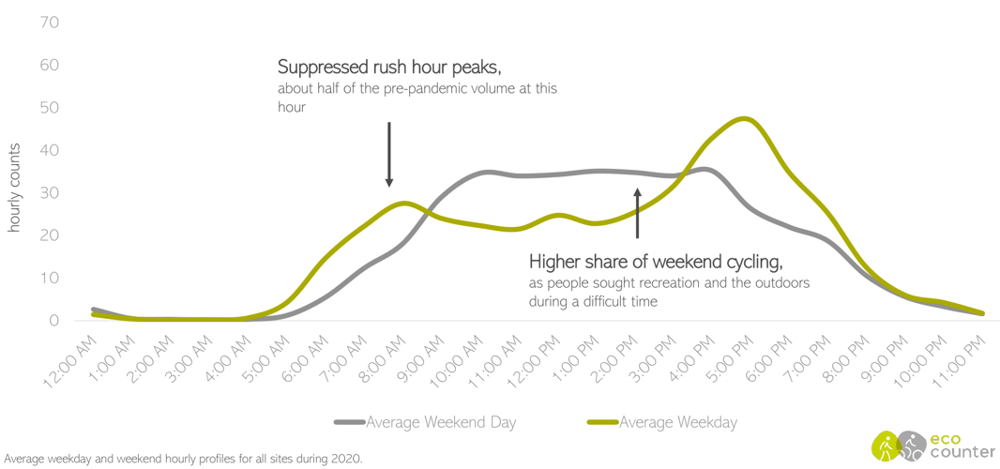
The impact of the pandemic on daily cycling trends in Charlottesville.
Overall in 2020, weekend cycling grew significantly across the network, accounting for a much higher share of the week’s activities as people sought safe exercise and escape. This escapism was particularly seen on Charlottesville’s John W. Warner Parkway Trail, an important greenway that runs North-South across the city.
As soon as the pandemic hit in early March 2020 (week 11), trail use spiked 300-400% compared to the year-to-date average and average weekly counts for the same period in 2019. These record setting trends persisted throughout the most severe early months of the pandemic, finally levelling off in June. So far this year, trail use volumes are mostly above 2019 levels, but below the 2020 boom.
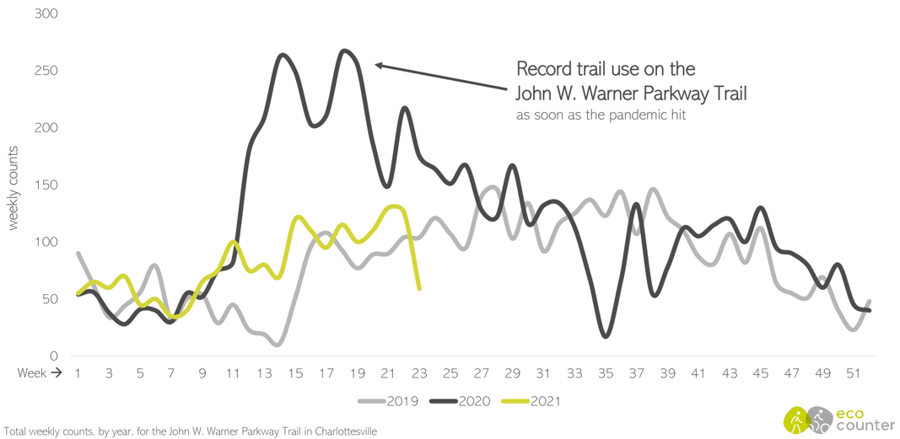
Weekly average bike counts 2019, 2020 and 2021 on Charlottesville’s Jon W. Warner Parkway Trail.
Lastly, our team explored the City’s annual active transportation survey data to get a better understanding of how streets are used and who is using them. These high-level trends have important equity implications for planners considering how to make streets safe, accessible and welcoming to everyone.

With the data analysis and visualization wrapped up, we topped off the Bikes Count grant with a powerful infographic, capturing the state of cycling in Charlottesville. Infographics, along with other data visualization tools, are an essential means for communicating with the public, justifying cycling infrastructure and, most of all, making bikes count.

What else did we learn about cycling in Charlottesville?
To inform municipal bike planning and communication with the public, our team shared a few final key take-aways for the team on the ground:
-
-
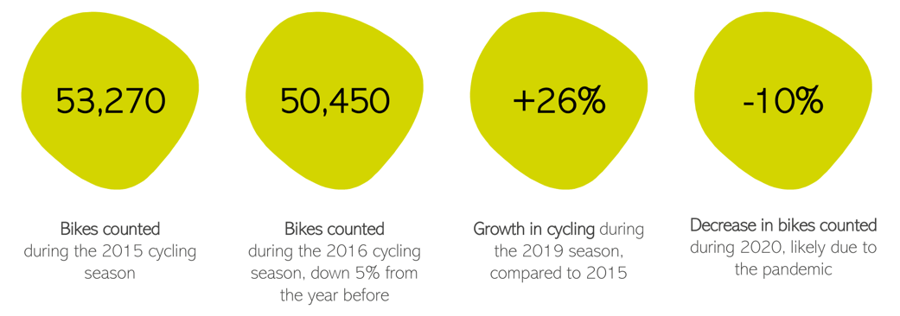
At West Main, activity in 2019 was 33% higher than in 2016 and 26% higher than in 2015.
-
Overall, the pandemic suppressed bike counts in Charlottesville. Early 2021 signs suggest a possible return to 2019 levels.
-
In pre-pandemic times, UVA has a strong impact on cycling. Activity at West Main in fall 2019 was 22% higher than during summer break.
-
It’s been a lot of fun working with The League of American Bicyclists, Treasure Valley Cycling Alliance (TVCA) and the City of Charlottesville this summer and we hope you’ve enjoyed following along. Stay tuned to our blog and newsletter for the latest news on future grant programs and data competitions.
Want to learn more?
-
-
Check out webinar recording ‘How To Make Your Bike Data Count’, which is available on YouTube here.
-
Download our PDF guide ‘How to Build a Bike Count Program’
-