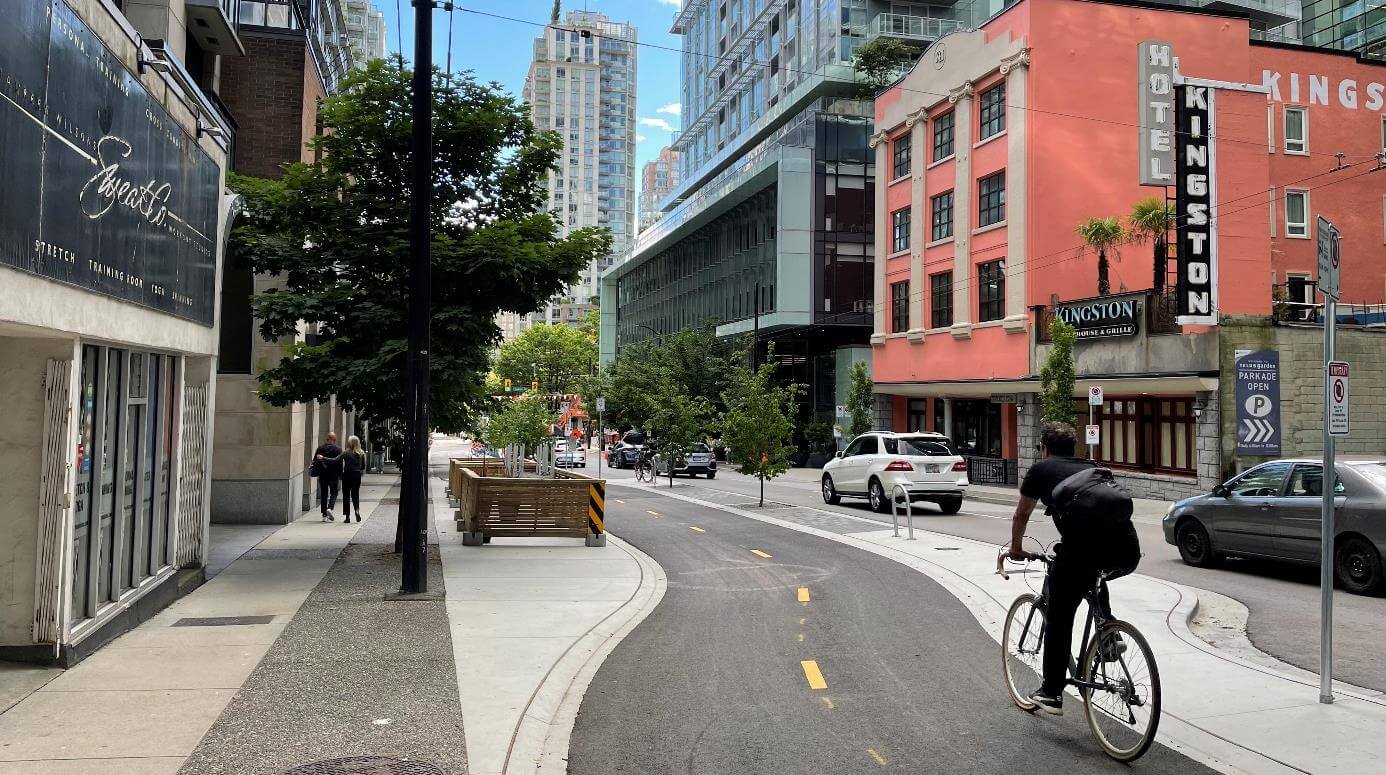
The first step in achieving these goals was to develop and implement a well-connected and protected bikeway network that significantly increased the number of cyclists of all ages and abilities. Then the City had to figure out how and where the collisions were happening to reduce risk exposure – and that’s where Vancouver’s mature count program for monitoring cycling activity came in.

How we’re helping the City of Vancouver achieve its Vision Zero goals
We fused years of data from permanent counters in key cycling areas of the city to conduct a network study with three types of analyzes to identify traffic and safety trends over the past decade:
Temporal
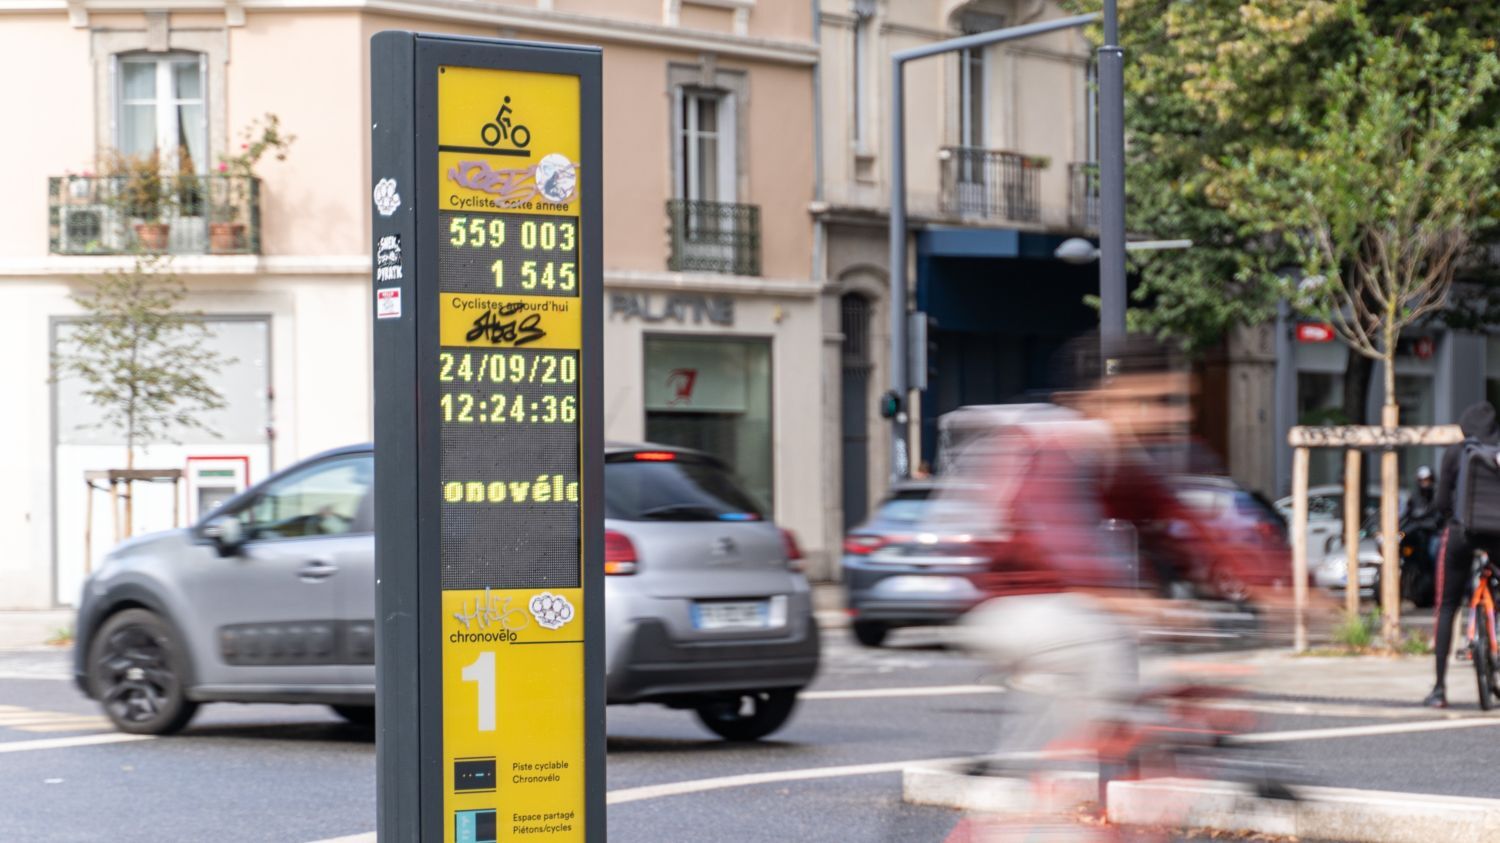
Our data analysts examined count data from 2010 to 2020 to assess monthly and annual increases in bicycle traffic and how the pandemic impacted cycling in the city.
Geospatial
Data from automated counters and anonymized bicycle route data from SmartHalo users were combined to create a heat map of cycling activity in Vancouver. This allowed us to identify where intersection treatment and maintenance should be prioritized and where bicycle-friendly signalization and parking are needed.
Safety
By combining estimates of bicycle activity with bicycle-vehicle crash data, we calculated crash risk and mapped the frequency and rate of bicycle crashes across the city.
Eco-Counter products used in this project
 Eco-Visio
Online, easy-to-use data analysis platform.
Learn more about Eco-Visio.
 ZELT
ZELT
The world’s most trusted permanent bike counter, designed for urban cycling and bicycle tourism.
Learn more about ZELT.
 TUBES
TUBES
Mobile bike counter, designed with short-term bike volume studies in mind.
Learn more about TUBES.
Key findings on bicycle use and safety in Vancouver between 2010 and 2020
-
-
Cycling in Vancouver has increased significantly and steadily over the past decade, coinciding with and driven by the large-scale expansion of the protected bikeway network.
-
Winter cycling is becoming more common and has increased steadily over the past five years.
-
Bicycle traffic remained high during the pandemic, but peak activity shifted from commuting times to afternoons and weekends.
-
In 2019 and 2020, reported collisions decreased significantly compared to the previous four years. An expanded protected bikeway network with reduced vehicle exposure in 2020 likely contributed to the lower collision rates.
-
Cyclist collision risk is highest in late fall and early winter.
-
The study of collision risk at intersections found that there are a handful of higher risk intersections throughout Vancouver. Most of these intersections are located on major arterials with high traffic volumes and no protected cycling infrastructure.
-
Turning numbers into actionable advice
The results of this analysis will allow the City of Vancouver to assess which initiatives have been effective in promoting cycling and in which areas more cycling and safety infrastructure is needed. By being able to assess progress toward its 2040 Vision Zero goal, the City will also be able to prioritize infrastructure investments where they’ll be most effective.
Want to learn more about this analysis? Read Cycling in Vancouver: A portrait of bicycle ridership and safety in Vancouver 2010-2020.
How is your data working for you?
Great data means nothing if you don’t know what it’s telling you.
Eco-Counter’s data analysts can help you collect and understand your data so you can use it to manage your organization and make better decisions.
Call us at 514-849-9779 or send us an email to learn how we can help you put your data to work.