With such drastic limitations placed on peoples lives, what is the impact on bike and pedestrian count data around the world?
FRANCE
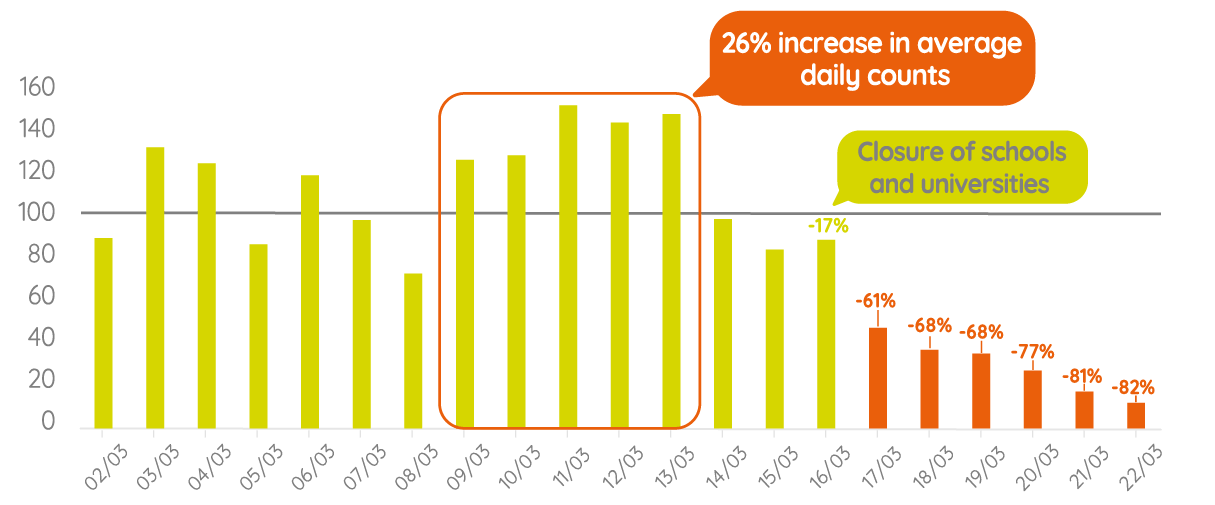
Analyzing data from all bike counters across France with public-data, we can see that since the start of mandatory confinement on the 17th of March 2020 at noon, bicycle counts have decreased sharply compared to average. Looking closely at the data, we also see a gradual decrease each day in counts following the confinement. On March 22nd, bike counts across France were down 82% vs. what would be expected.

Source: 21 bicycle counters across 15 cities in France.
A few examples:
In Toulon, two recently installed Eco-DISPLAY Classic counters captured an important decrease in counts. By looking at the hourly profile of these two counters, we see that one route is used for commuting travel (with peaks in morning and evening traffic), while the second route is used for recreational cycling. In both cases, there has been a significant drop in bicycle traffic since the confinement rules went into effect, a sign that the efforts are reducing both utilitarian and recreational cycling.
ITALY

Every country has reacted to the Coronavirus pandemic differently. In Italy, the COVID-19 lockdowns were put into place earlier than in France, and the impact only daily bicycle counts has followed a similar trajectory. One notable difference, however, is that the partial and progressive lockdown of the country has led to different phases in the decrease in bike counts.
At first, on the 21st of February, 11 municipalities in the province of Lodi were placed on lockdown. After this initial lockdown, the average daily bike counts nationally decreased by 14% compared to the reference period (the month previous to the outbreak).
Once the north of the country was put into lockdown on the 8th of March, we saw bike counts drop drastically – 34% compared to the baseline average.
Finally, once the whole of Italy was placed in lockdown on the 10th of March, average daily bike counts fell further and continue to decrease until today.
One other difference to France was that Italy did not see increase in bicycle traffic at first as users switched from public transit to cycling, as was observed in France. Instead, a gradual decline in cycling has been seen throughout the pandemic so far.
GERMANY

How has daily bike traffic evolved in Germany? With confinement measures being applied differently accross the country, we see different trends, as well as the effect of nice weather during the week-end.
Go further with data
Informing data-driven active transportation planning
Our bicycle and pedestrian counters provide an essential stream of data, an important tool for for managing and understanding crises such as COVID-19. In this case, understanding bicycle count trends can gauge the effectiveness of measures taken by governments to limit travel in order to halt the spread of the virus.
Did you know?
Eco-Counter’s online data analysis platform, Eco-Visio, allows you to generate automated PDF reports overviewing your count data – a useful tool to quickly share a broad synopsis of count data with partners and stakeholders.
Want to learn more about bike and pedestrian counts and what Eco-Counter can do for you? Get in touch.