Eco-Counter Worldwide Cycling Index: a stable trend for global bicycle traffic from 2016 to 2017
After seeing a stable trend from 2015 to 2016, the 2018 Index shows a stable trend for bicycle traffic between 2016 & 2017 (+0.2%). This global Index is calculated by measuring, checking and validating the difference between 2016 and 2017 total count data gathered from the 2,725 counters worldwide. The trend is then determined proportionally according to the population of the country where the counters are located (see detailed methodology below).
The analysis by population highlights a stable trend per country.
In spite of this, there are notable discrepancies between countries. The countries with the biggest increase are as follow: Luxembourg (+10%), Italy (+10%), New Zealand (+6%), France (+6%), Ireland (+6%), Great Britain (+3%), Switzerland (+3%), Spain (+2%) and Austria (+1%).
Then comes Netherlands, Sweden, Australia and Chile where the trend is stable.
Germany (-1%), United States (-2%), Poland (-2%), Denmark (-3%), Canada (-4%), Finland (-4%), Czech Republic (-6%) and Norway (-7%).

Top 5 Cities where bicycle use is growing the fastest
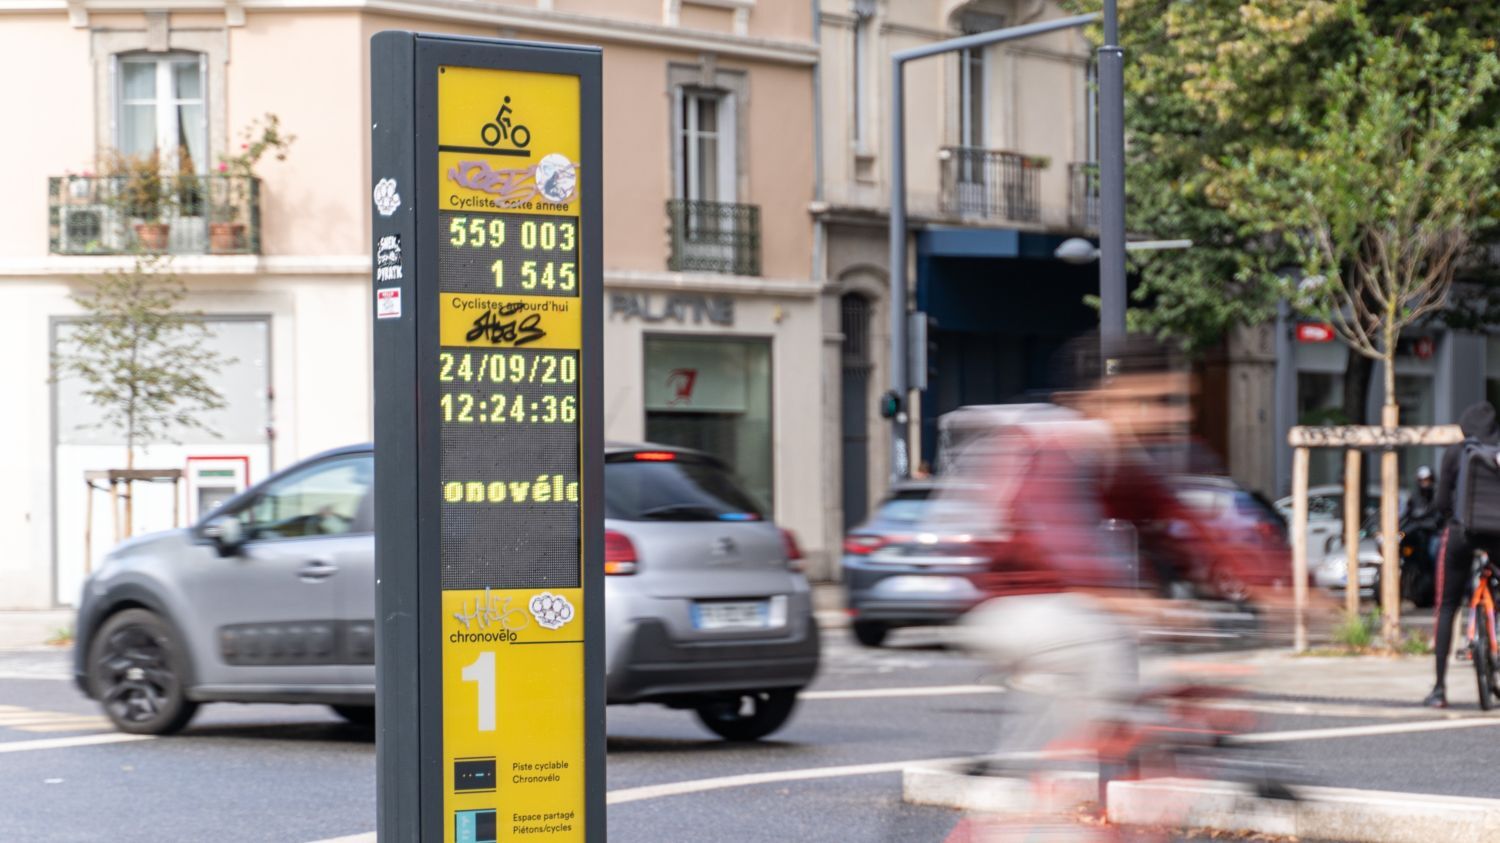
The Index also provides an analysis for the cities that owned more than 10 bicycle counters in 2016 and 2017. The 5 cities with the highest bicycle use progression rate from 2015 to 2016 are as follow: Nantes (FR), Tauranga (NZ), Lyon (FR), Sant Gallen (CH), and Warsaw (PL).

Methodology
Full methodology is available upon request.
Global analysis
- Data extracted from the Eco-Visio global database to analyze bicycle counters only.
- Minimum of 4 months of comparable data between 2016 and 2017 for each specific bicycle counter.
- Manual check and validation of the whole database (exclusion of null data, inexplicable and/or strong variation).
- Global traffic progression weighed proportionally according to each country’s population.
Per-country analysis
- Countries with less than 10 validated counters were excluded from the analysis.
Appendix – Global and per-country progression
| Country | 2016-2017 Evolution | 2015-2016 Evolution | 2014-2015 Evolution | 2013-2014 Evolution |
| Australia | stable | stable | 3% | N/A |
| Austria | 1% | 1% | stable | 12% |
| Canada | -4% | -1% | 6% | stable |
| Czech Republic | -6% | -2% | -1% | stable |
| Denmark | -3% | 6% | -2% | N/A |
| Finland | -4% | -3% | 4% | N/A |
| France | 6% | 3% | 2% | 10% |
| Germany | -1% | 1% | stable | 14% |
| Ireland | 6% | 8% | -2% | N/A |
| Italy | 10% | N/A | N/A | N/A |
| Luxembourg | 10% | N/A | N/A | N/A |
| Netherlands | stable | N/A | N/A | N/A |
| New Zealand | 10% | 5% | 1% | 3% |
| Norway | -7% | 7% | 1% | N/A |
| Poland | -2% | 2% | 3% | 12% |
| Spain | 2% | stable | 8% | -2% |
| Sweden | stable | 1% | -1% | 6% |
| Switzerland | 3% | -1% | 6% | 11% |
| United States | -2% | -2% | 4% | stable |
| United Kingdom | 3% | 3% | -2% | 12% |
| Global | stable | stable | 3% | 8% |