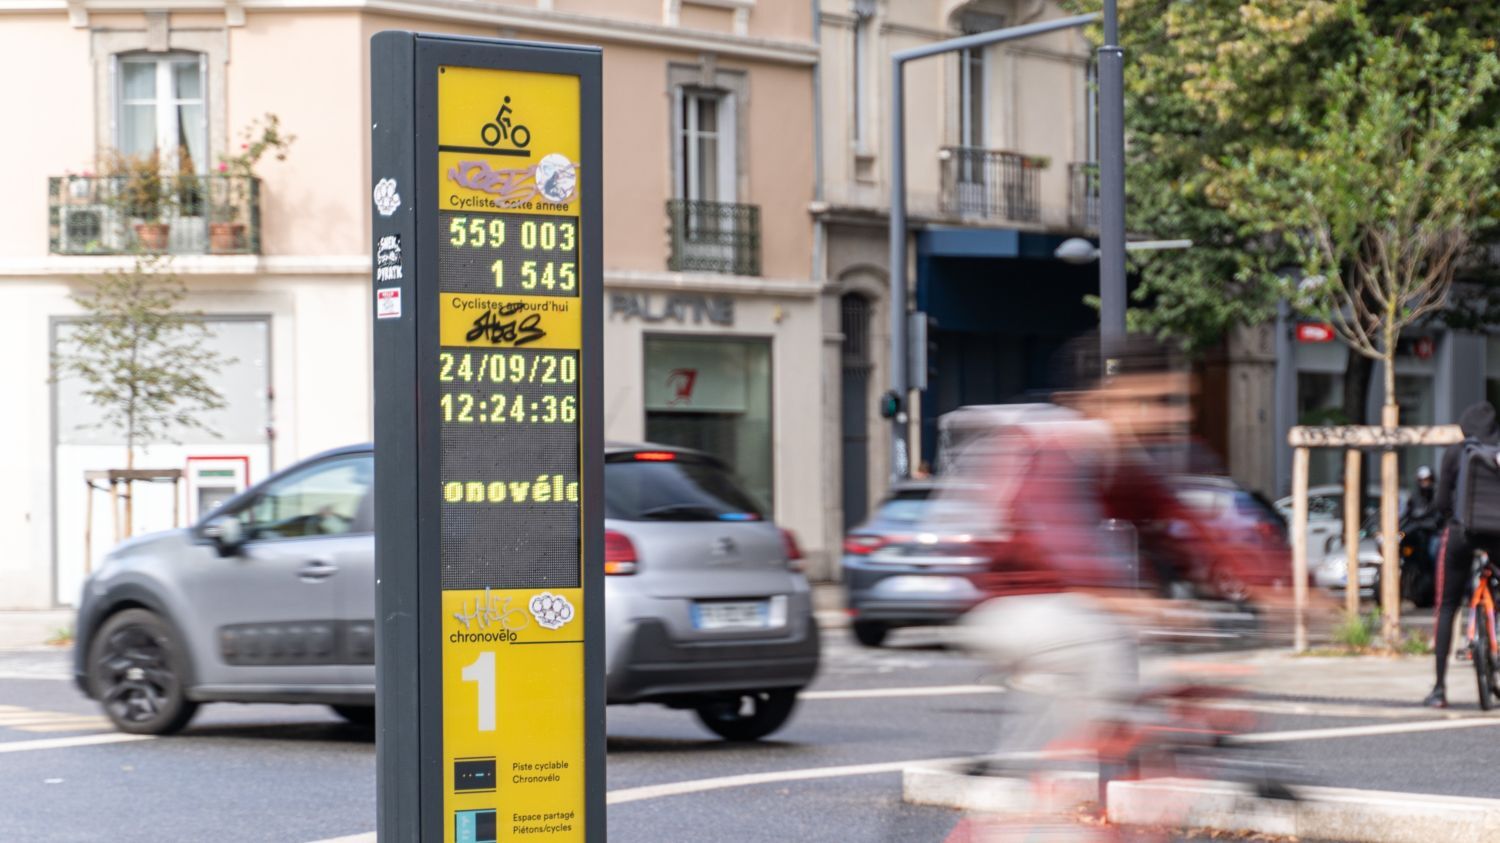
Locations that are considered utilitarian are characterized by having clearly defined commuter peaks in the morning and afternoon, and higher usage on weekdays than weekends. Recreational sites, on the other hand, are used more on weekends.
The latest data is available on the organization’s Public Business Intelligence Hub. In this post, we’d like to share with you three interesting cycling trends we’ve observed since the pandemic began in 2020:
Shift in bicycling behavior in 2020
The covid-led transition to remote work and the increased popularity of outdoor activities have changed society in many ways, including bicycling behavior. As people stopped riding to the office, there was a 10% decrease in utilitarian cycling in 2020 compared to 2019, with fewer cyclists on commuter routes during traditional peak hours before the pandemic began.
Recreational cycling, on the other hand, grew by 63% on average and nearly doubled in the southwestern U.S. – which makes perfect sense, since bicycling was a safer recreational activity while maintaining the necessary social distance.
Another shift in 2021
While the number of utilitarian bicyclists continued to decline in 2021 as remote work remained popular, the number of recreational cyclists didn’t increase as much as in 2020-only 26% compared to 2019-possibly due to widespread vaccination and the resumption of indoor activities that offered a wider range of recreational options. Nonetheless, this is a sustained and significant increase compared to pre-pandemic levels.
Impact of climate change on cycling activity
An unusual 3% drop in cycling on the West Coast in the summer of 2021 caught our attention. Although bicycling is traditionally higher in the U.S. in the summer, the wildfires that ravaged California and Oregon in 2021 may have been the reason for the uncommon decline last year, as the period of lower cycling coincided with the worst moments of wildfires and the highest levels of air pollution.
Unfortunately, this trend is likely to intensify with the severity and frequency of climate-related events such as wildfires, heat waves, and flooding.
Check out the People for Bikes website for more information on current trends in bicycling in the United States.

How has cycling behavior changed in your community over the past years?
We’d love to know – drop us a line in the comments!
We’re also interested in your suggestions for more data analysis you’d like to see, and your questions for our Data Services Lead David Beitel, who provided the information and analysis for this post.