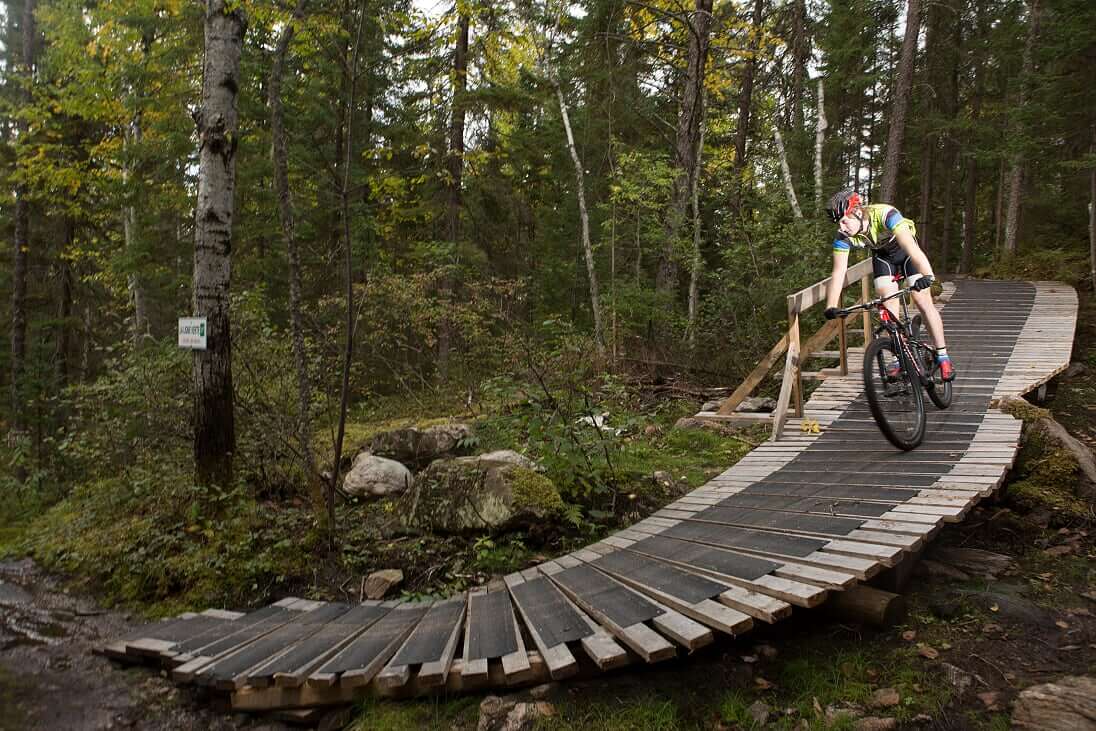

The winner in 2020 was the mountain bike organization Club Vélo2max (Vélo de Montagne Saint-Félicien) in the beautiful Saguenay region of Quebec. In their grant application, Club Vélo2max outlined two principle objectives for their count program: 1) understand how and when their mountain bike trails are used and; 2) have data on hand to inform grant applications from local, regional, and federal funding streams for outdoor recreation.
Three months to launch a trail count program
The trail managers at Club Vélo2max decided to install the PYRO-Box people counters at two principle locations. The first counter was installed at the main entrance to the trails, next to the ticket window. With this counter, the trail managers would be able to compare count data with ticket sale data, therefore providing a good estimate of the total number of visitors throughout the year. The second counter was installed at a small river crossing trail which captured a large amount of the trail traffic. ‘Funnel’ sites like this (and similar trail locations such as connector trails, climbing trails, bridges etc.) are excellent locations for counters as they capture a large share of trail users.


Count data to justify, maintain and manage mountain bike trails
After three months – August, September and October 2020 – Club Vélo2max was able to gain a broad understanding of when and how many people use their trails. Let’s start by looking at the busiest day during the count period. As you may expect, it was a picture-perfect fall Saturday in September.

How about the weekly distribution of counts? You may be able to correctly guess the trends here too, as the trails were significantly more used during the weekend than during the week. However, although counts were 2-3x higher during the weekend, the trails were still well used during the week, with an average of 100 counts per day at the bridge counter between Monday and Friday.
With this data in hand, trail managers were able to adapt their operations in line with what the counts show, notably by modifying the days in which staff were scheduled to work at the welcome center and also by adjusting volunteer schedules to cover the busiest periods of the week.


Let’s now take a look at each day more closely, asking the questions: how are trails used throughout the day? Are those trends the same during the week as they are during there weekend?
Some really interesting trends emerge here…
During the weekend, the peak period is spread out throughout the day between about 11am and 4/5pm. During the week, however, there are spikes in trail use at 4pm and also at about 7/8pm, suggesting that people are enjoying the trails briefly after work.
It should be noted that the graph below does not represent total counts per hour, but the % of total counts each day, by hour.

How did the end of the season unfold for Club Vélo2max? In Quebec, beautiful fall colours and mild temperatures make for spectacular mountain biking in September and October. The season ends quickly, however, with the snap arrival of snow and a deep winter. In the case of Club Vélo2max, their trails closed for the season at the end of October last year. Let’s look at the daily count data for the last two months of the season to see how things wrapped up.
Trial use was particularly high during the early fall weekends in 2020 and then remained quite high for the rest of the season, with the exception of a few poor weather days. Once the trails closed at the end of October, the counters registered zero counts per day, suggesting that the trail closures were being respected by riders – something that always makes trail managers very happy!

Putting 3 months of trail count data to use
You can do a lot with a small amount of count data. With only two counters for 3 months, Club Vélo2max was able to understand how their trails are used and estimate total visitation.
In the future, trail managers would like to install a few extra trail counters to understand the impact of a new beginner trail and how ridership compares to other more challenging trails and gauge the demand for easier trails. The organization are also curious to install counters at different trail access points to understand how users enter and exit the network. In winter, as the trails switch over to snowshoeing, fatbiking, and cross-country ski trails, the counters will be useful to understand volumes in different seasons and trail use trends during the snowy months.
This spring, we will launch the second round of our grant program with Vélo Québec, offering mountain bike communities in Quebec the opportunity to win 2 PYRO-Box people counters for 3 months once again. Stay tuned for more information about this year’s grant and be on the lookout for more resources coming your way, including a webinar in the spring.
—
More resources:
- Learn more about the grant program with Vélo Québec (in French)
- Learn more about our partnership with IMBA
- Missed our webinar on best-practices for trail counts with IMBA earlier this year? Watch it here.
—
Cover image source: Club Vélo2max (Vélo de Montagne Saint-Félicien)