- Home
- Counting solutions
- Eco-DISPLAY Classic +


.webp)
.webp)
.webp)


.webp?width=1920&height=1080&name=14_EcoDisplayClassic%2B%20(1).webp)
.webp?width=1200&height=800&name=EDC%2B_VEJLE_DK%20(13).webp)

DISPLAY range
Eco-DISPLAY Classic +
A high-visibility, real-time count data display for bicycles, pedestrians, scooters that shows dynamic, customizable text to passers-by.
- Large and highly visible
- Fully customizable design
- Many display options (counts today, counts this year, date, time, temperature, etc.)
- Excellent communication tool for passers-by in high-traffic areas
- Can be installed on shared paths
Complete description
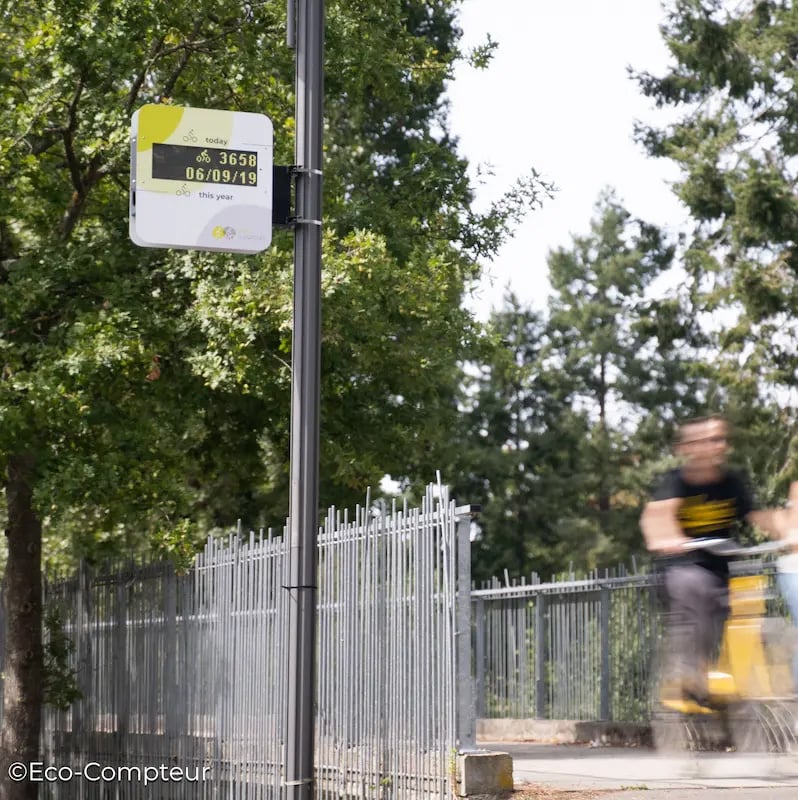
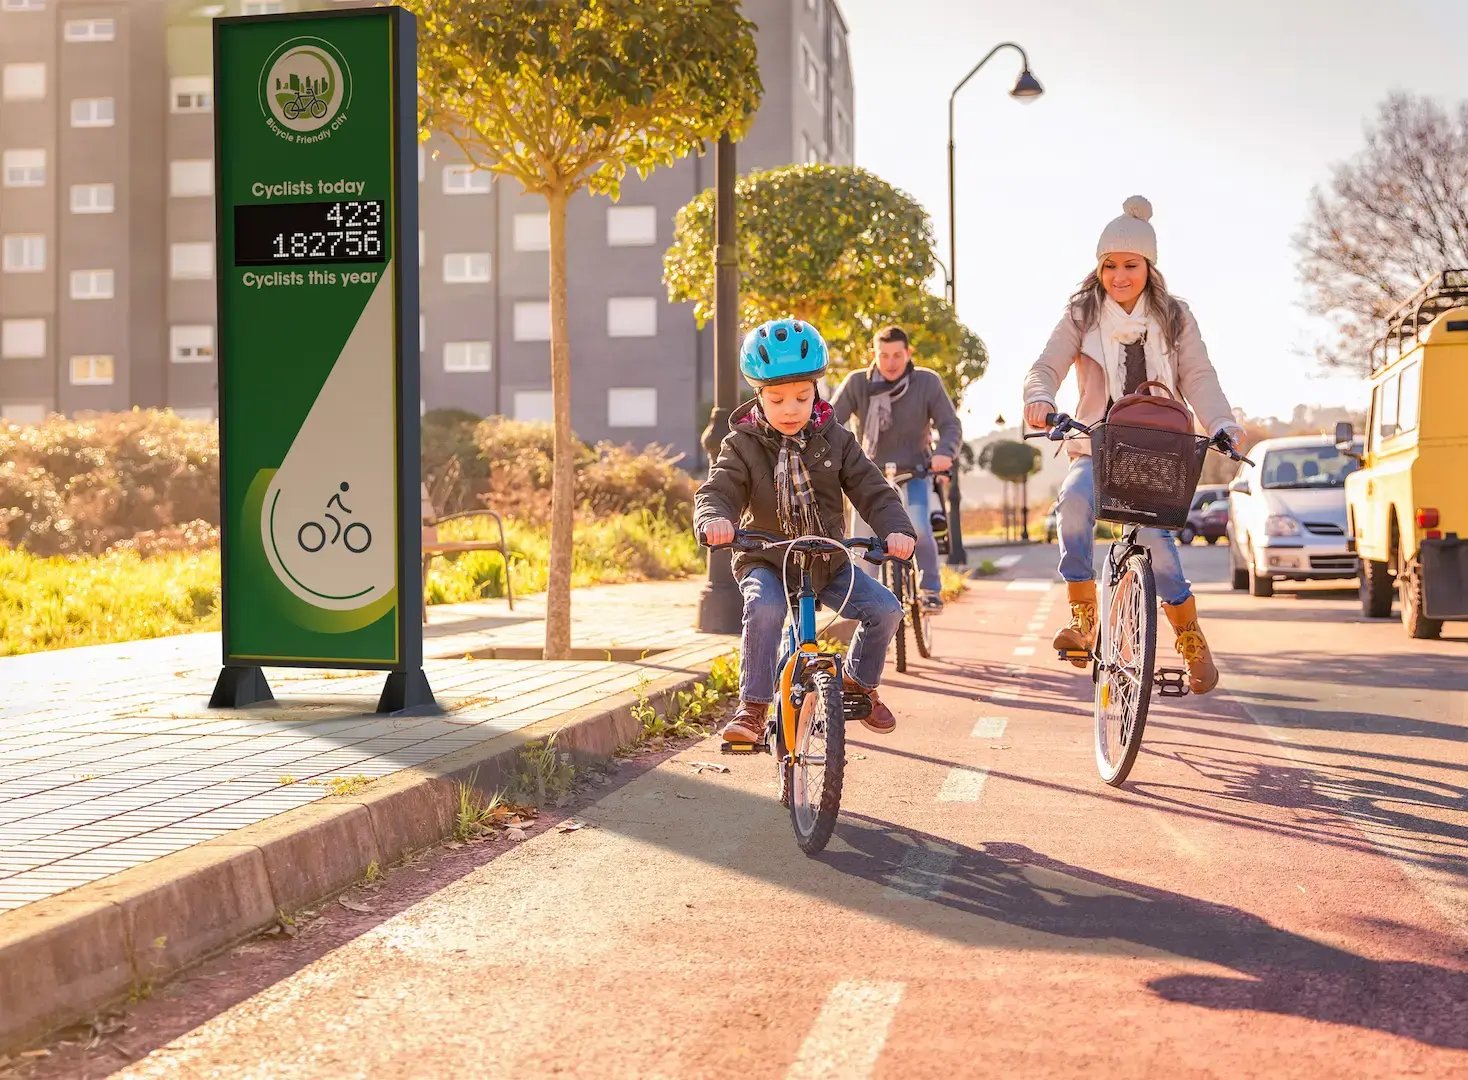
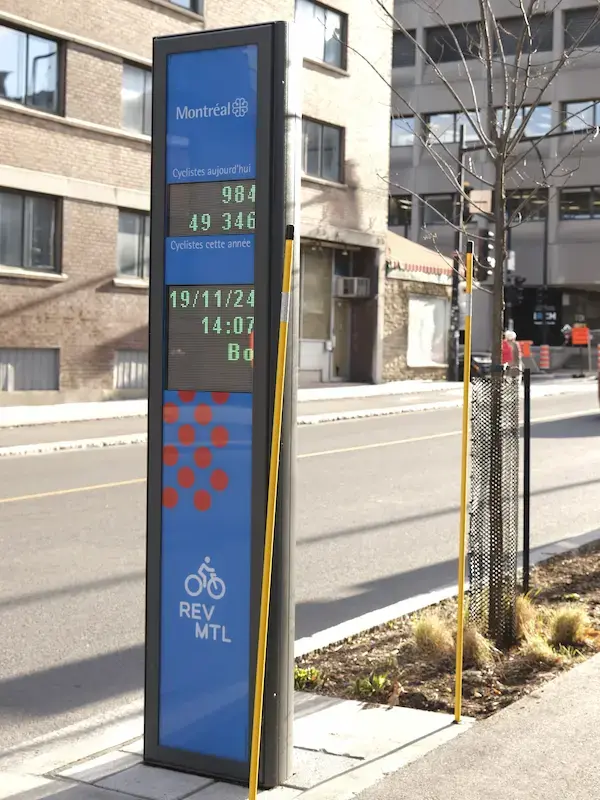
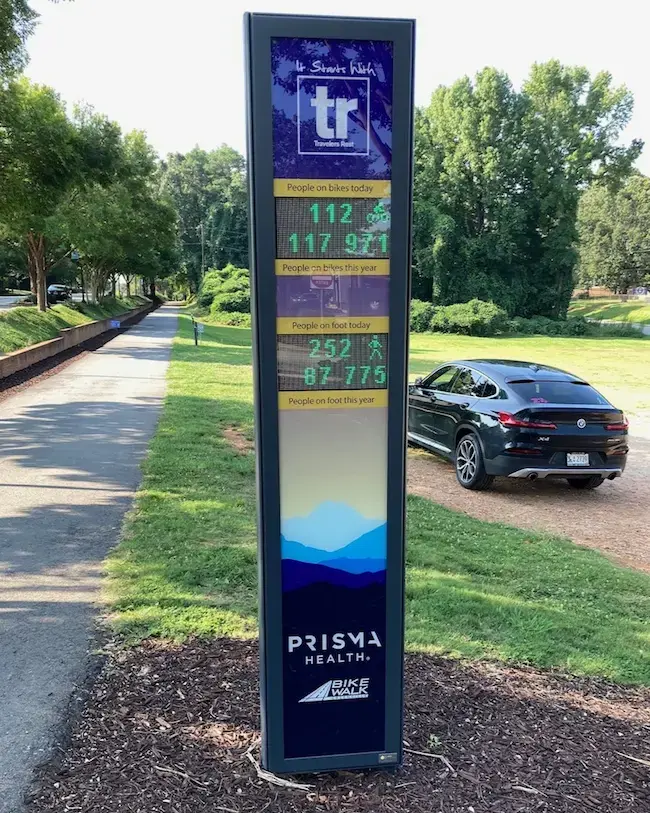
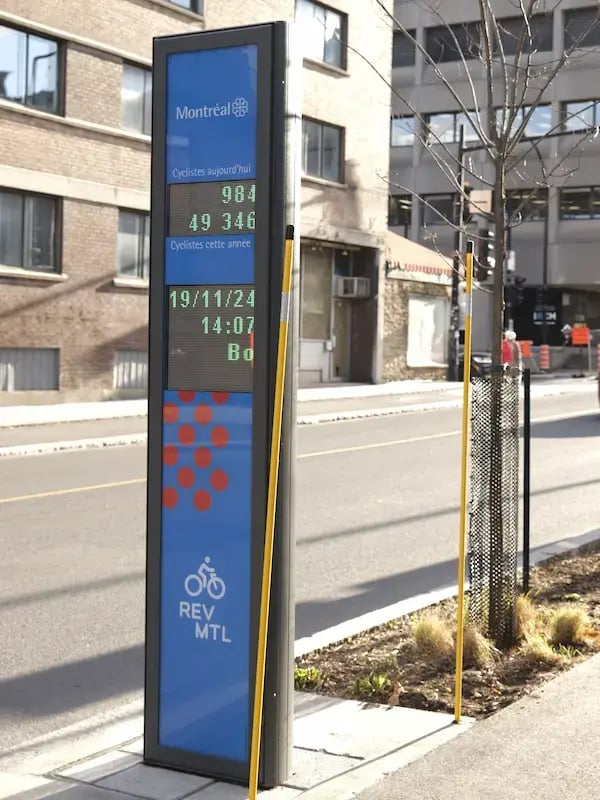
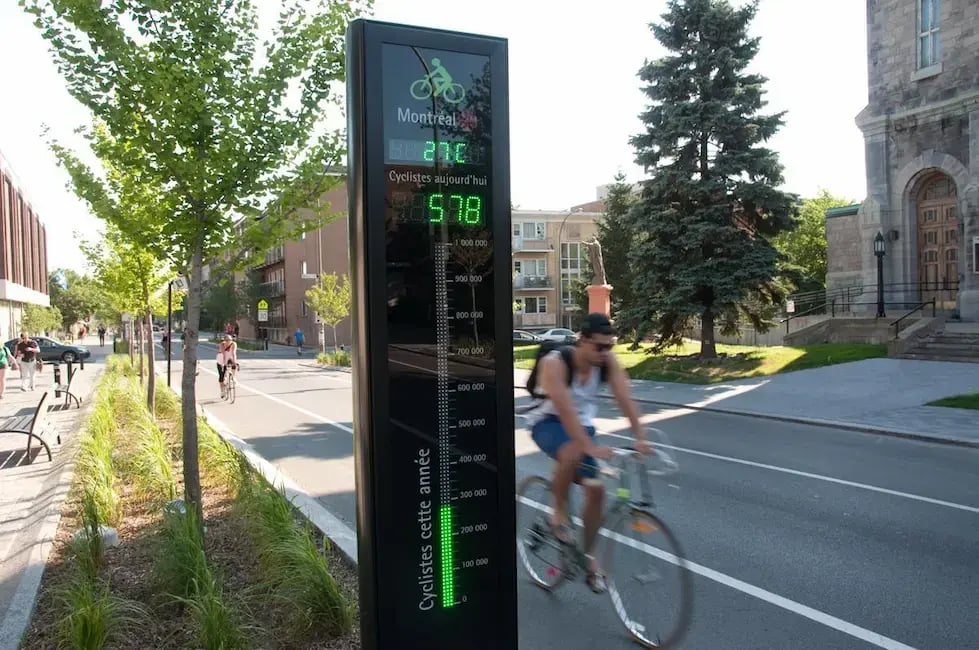
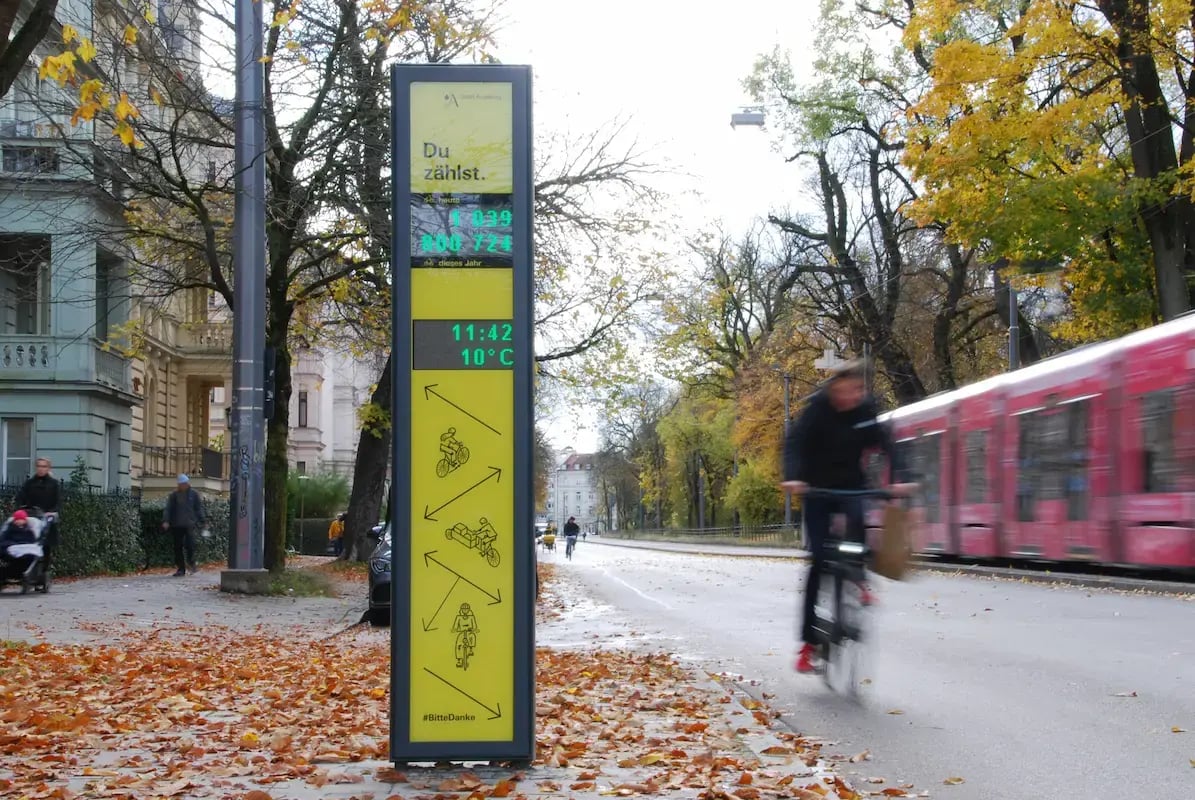
The Eco-DISPLAY Classic+ (EDC+) is a high-visibility, real-time count display that doubles as a dynamic piece of street furniture. This solution presents bright, customizable text along with the data of your choice such as date, time, or temperature to passers-by. This effective and popular communication tool is made to promote cycling, walking, and other forms of active transportation in your community.
See live counts of Eco-DISPLAYs around the world on our Eco-Display World Map.
How this high-visibility display works
The Eco-DISPLAY Classic+ pairs with other counting solutions such as the ZELT, MULTI, or CITIX-AI to make the data collected on these solutions instantly visible. The design of the panel is fully customizable by you, so you can design and display your organization's branding or message.
The count data you collect sent directly to our online software solution Eco-Visio, where it can be analyzed and shared with the public. The ComEth-based counting systems also allow for rich ITS integration options.

Encourage your cyclists and pedestrians
Designed to be seen, built to last
.webp?width=1375&height=1100&name=EDC%2B%20Austin%20(2).webp)

Quantify new modes of travel and micromobility
The proliferation of new micromobility devices is a major consideration for cities and urban communities. From user speeds to the use of e-scooters and e-bikes, it is crucial to analyze these new modes to avoid conflicts of use and provide the right infrastructure for all users. That's why the EDC+ counts, classifies, and displays scooters, bicycles, and other vehicles with a high level of precision.
Dimensions | 239 cm x 46 cm x 16 cm |
Weight | 110 kg |
Working temperature | -30°C to +50°C |
Waterproofing | IP 55 |
Material | Anti-graffiti and anti-rust powder-coated aluminum frame, PMMA front panel |
Client testimonials
"The counting system will allow us to understand the number of visitors to the new park, as well as seasonal visitation patterns. This data will help us determine the best ways to ...manage and market Presidio Tunnel Tops. "
“The count data is really inspiring. The way the information is presented (in Eco-Visio) – by day of week, user, busiest day – is so well and professionally presented.”
"The data is a real decision-making tool. They help us to plan better development projects, adapted to the observed traffic. They provide a greater understanding of the ...distribution of visitor numbers...to support the services offered in the park."

Presidio Tunnel Tops Park in San Francisco, California was created after the highway leading to the Golden Gate Bridge was replaced by tunnels. From day one, the park’s marketing manager wanted to understand how successful the new landmark was. To support that goal, Eco-Counter solutions were installed to provide long-term insights and guide informed decision-making.
See the case study-3.webp?width=939&height=800&name=AdobeStock_85747125%20(1)-3.webp)
The Napa Valley Vine Trail is a popular 18.5 mile (and counting!) multi-use trail in Napa, California. Pedestrians and cyclists along the route are counted and differentiated, and their direction of travel is also recorded. This data helps the trail's coalition understand how the trail is used, plan new developments, and secure funding for expansion.
See the case study
Discover how the City of Montreal manages one of the city's most important green spaces: Mount Royal Park. Visitor data is used for many reasons, from measuring winter ski and snowshoe use to measuring bicycle traffic volumes in the summer. Discover the Eco-Counter solution they used to make their park management easier.
See the case studyFrequently asked questions
How do I produce an annual traffic report?
Our Eco-Visio data analysis platform has been designed to be as ergonomic as possible, enabling you to easily edit any type of data report.
However, if you'd like further advice, we offer webinars on specific topics such as report editing. Contact us to find out more!
How do I keep my counter in good working order?
An occasional visit to the counting site allows you to check that everything is in place, or that any work has not affected the installation.
Our Eco-Visio software also enables you to monitor data remotely and check the remaining charge on your batteries.
How do I know if my counter is properly installed?
Our Eco-Link Evo mobile application lets you test your counter. Don't hesitate to call our support team to check that everything is working properly.