- Home
- Developing active transportation
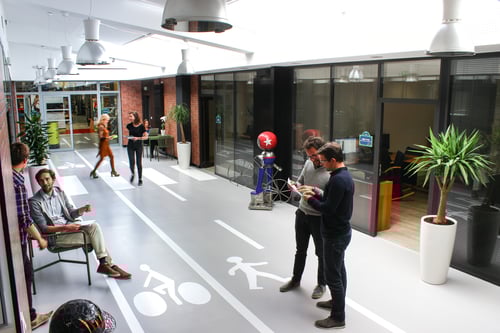
- Developing walkability in the city
Developing walkability in the city
Walkability refers to the ease and convenience with which a public space can accommodate people on foot. This concept assesses the quality of urban spaces in terms of safety, accessibility, interconnectivity and attractiveness for pedestrians. The underlying aim is to develop pedestrian flows with effective urban planning and precise footfall indicators.
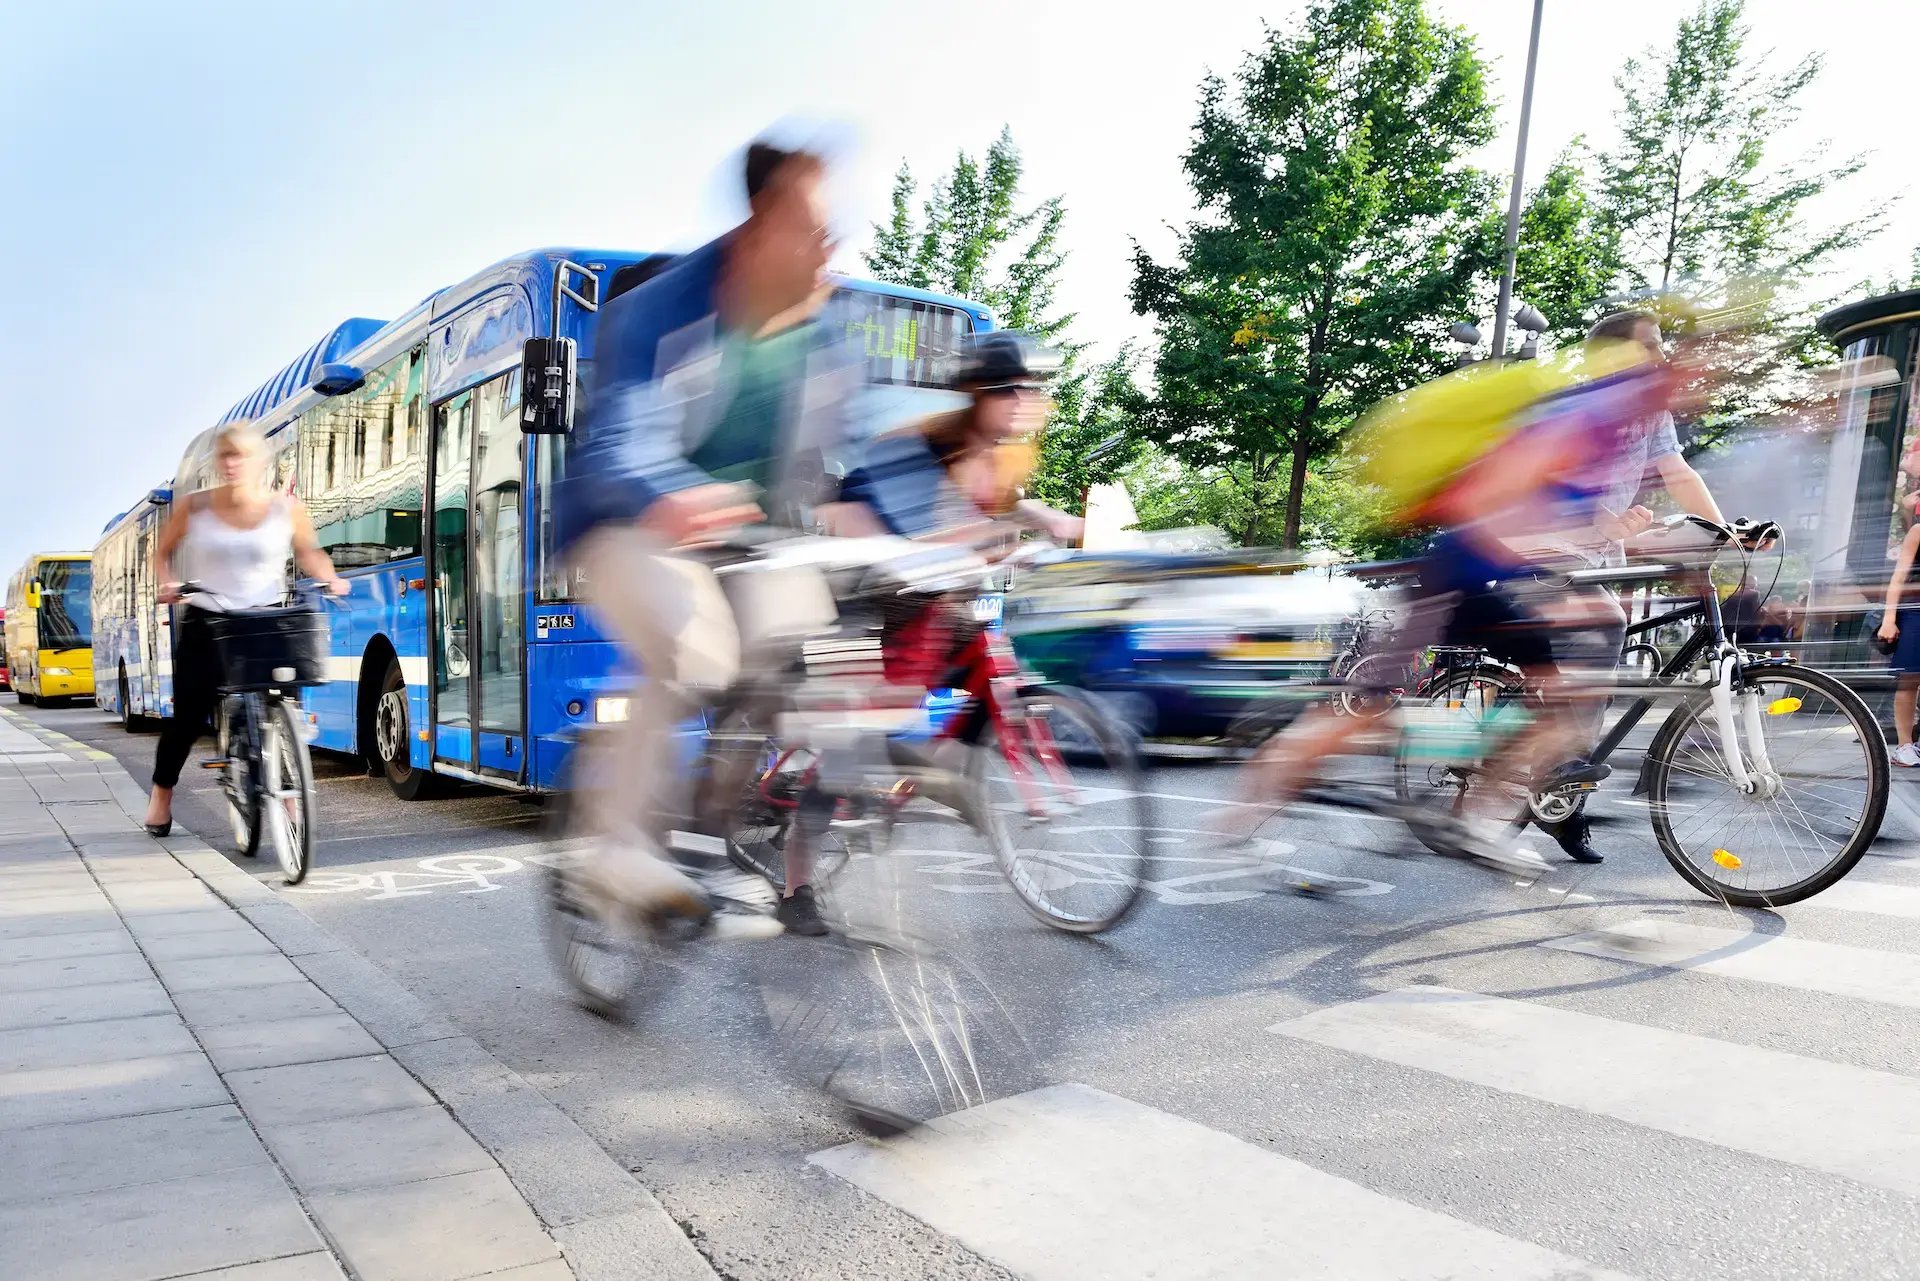
To grow, the practice of walking in the city must be supported by quality infrastructure, safe intersections, and specific work on the accessibility of these facilities for all (and in particular people with reduced mobility).
In addition, cities need to consider which modes to prioritize, how to minimize conflicts of use, and how to encourage active transportation.

Why is developing walkability a key issue for public health and quality of life?
With a modal share of just 4% compared to the global average of 22%, North Americans spend much less time walking than the rest of the world.
This has major implications on our population's overall physical and mental health. Interestingly, the majority of Americans support the idea of a 15-minute city, i.e. a city where citizens can reach all the key amenities they need within a 15-minute walk or transit. So, this suggests that low walking rates are a result of insufficient infrastructure, not preference.

How can we measure and improve walking and pedestrian accessibility?
Several types of indicators can help local practitioners assess policies when developing walkability in their city (awareness-raising, communication, pedestrianization, urban transformation, reducing transit traffic, etc.).
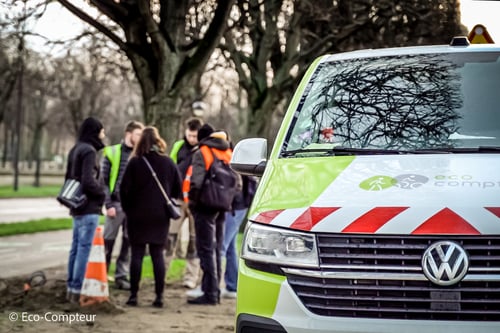
Average annual daily traffic

Average Annual Daily Traffic (AADT) is a standardized indicator for measuring pedestrian traffic at a given location, and tracking its evolution over the long term.
By using several counters, it is possible to easily identify the busiest points in an area, and understand how pedestrian traffic evolves from one year to the next. This makes it possible to measure the effectiveness of policies to develop pedestrian accessibility: widening sidewalks, pedestrianization, traffic plan revisions, urban transformations, etc.
An overview of user feedback

User feedback on the attractiveness of a location can also be used to guide walking development policies. Two examples:
- The "Walk Score", which gives a quick indication of a location's walkability, based on the possibility of finding as many amenities as possible within walking distance.
- The Walkability application (developed by the international charity Walk21) enables each citizen to share their feelings about the walkability of an area, with different types of shareable qualitative information.
Average distance covered

Average distance sheds another light on how people are walking. It can be used to measure the effects of communication policies, pedestrianization, or signage that encourage people to walk (such as signs indicating the main destinations in a neighborhood in terms of distance or travel time).
By regularly measuring this average distance, we can analyze how the practice is evolving in terms of both volume and regularity.
With the development of dedicated, safe infrastructures, the average distance tends to increase.
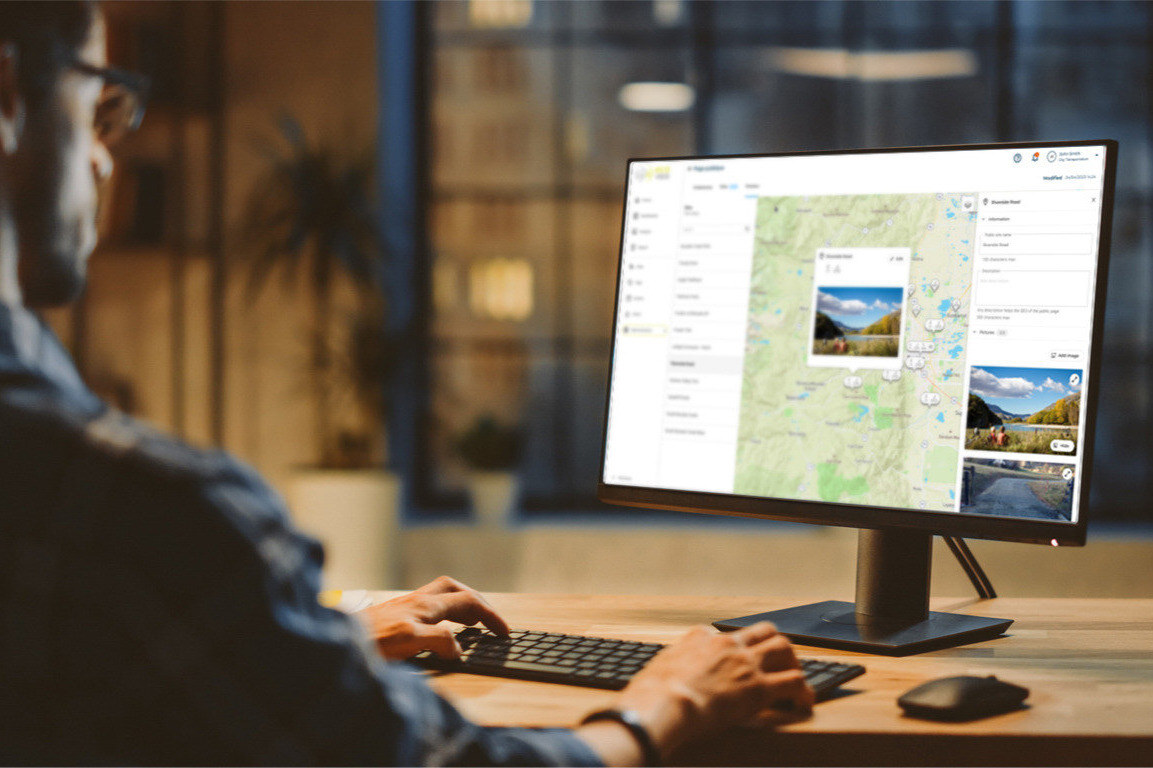
VisitorFlow: combining count and mobile data for more walkable cities
VisitorFlow is the only solution on the market to combine precise, ground-truth count data with mobile data (cellphone data, applications) for a quantitative AND qualitative analysis of pedestrian flows.
Thanks to this, cities can identify and track successes (increase in average distance traveled, rise in footfall, impact of pedestrianization) or obstacles (weather factors contributing most to the decline, impact of events).
Our VisitorFlow solution gives you the best of both worlds when it comes to pedestrian flow analysis and developing walkability.


How we help
Expertise
At every stage of your project (choosing count sites, selecting counting solutions, using analysis tools, etc.), our teams are here to help.
Support
Already have a project in mind? Contact us and our dedicated support team will help you get it started from square one.
Tools
Reliable hardware, user-friendly software, and guaranteed data quality: we provide a complete solution with products and services to get you the best possible data.
Going further
Would you like to explore topics related to the development of sustainable mobility? Discover how data can help you address these other issues.
Modal share
& space allocation
How wide? Which direction? For whom? Building pedestrian and bike facilities is no easy task and requires reliable data to make the right decisions.

Vision Zero
Vision Zero is an international traffic safety project that aims to eliminate deaths or serious injuries on road networks. This initiative calls for specific data on vulnerable road users such as pedestrians and cyclists.

Weather Impacts
The effects of the weather (rain, snow, heat, wind) on active modes are indisputable but often misunderstood. Analyze how weather causes behavior changes and make the right decisions about infrastructure maintenance.
How do you interpret pedestrian traffic data?
To assess an area's walkability, a number of pedestrian traffic indicators provide a range of information:
- Trends before and after an investment.
- Long-term trends.
- Areas in need of improvement, thanks to speed, lack of counts, etc.
- Daily and hourly profiles.
- Influence of weather and seasons.
These indicators can be used to develop pedestrian flows.
How do you justify decisions based on data?
Sharing transparent, objective count data makes them irrefutable. To do this, create simple, visual indicators and pass them on to your partners, or share them on social networks with the general public.
- Argue for the success of a development.
- Evaluate the impact of a pedestrian zone on the economy.
- Present clear, detailed reports.
With all these elements, your mobility policy will be justified and proven.