In Los Angeles, parks have long been places of solace and escape for residents of the the notoriously dense city. North of the city, Runyon Canyon Park is a 160-acre mountainous park by Hollywood Hills, ripe with hiking trails and scenic vistas. Five miles to the east is Griffith Park, one of the largest urban parks in North America, covering 4,310 acres of Santa Monica Mountains.
One year in: counting a million visitors in Los Angeles parks
May, 2021
Since the start of the pandemic, parks and trails have become ‘essential spaces’ for people to get exercise, fresh air, and much needed space during this challenging time. In some places, however, this boom in park and trail use has lead to overcrowding and capacity issues, presenting park managers with difficult challenges of maintenance and conservation while at the same time enforcing social distancing.
In Los Angeles, parks have long been places of solace and escape for residents of the the notoriously dense city. In the north of the city, Runyon Canyon Park is a 160-acre mountainous park by Hollywood Hills, ripe with hiking trails and scenic vistas. Five miles to the east is Griffith Park, one of the largest urban parks in North America, covering 4,310 acres of Santa Monica Mountains.
Two magnificent parks, 21 counters
During the summer of 2020, the Los Angeles Department of Recreation and Parks – the managers of Runyon Canyon and Griffith Parks – kicked off an extensive count program to understand how and when the parks were being used. In Runyon Canyon park, 4 PYRO Urban Posts are installed near 3 principles gate entrances in order to understand how people enter and exit the park, in addition to accurately estimating the total number of park users each day, week and month. In Griffith Park, 17 Recycled Post PYRO people counters are discreetly installed around the park, on a mixture of trails, connectors and trailheads.

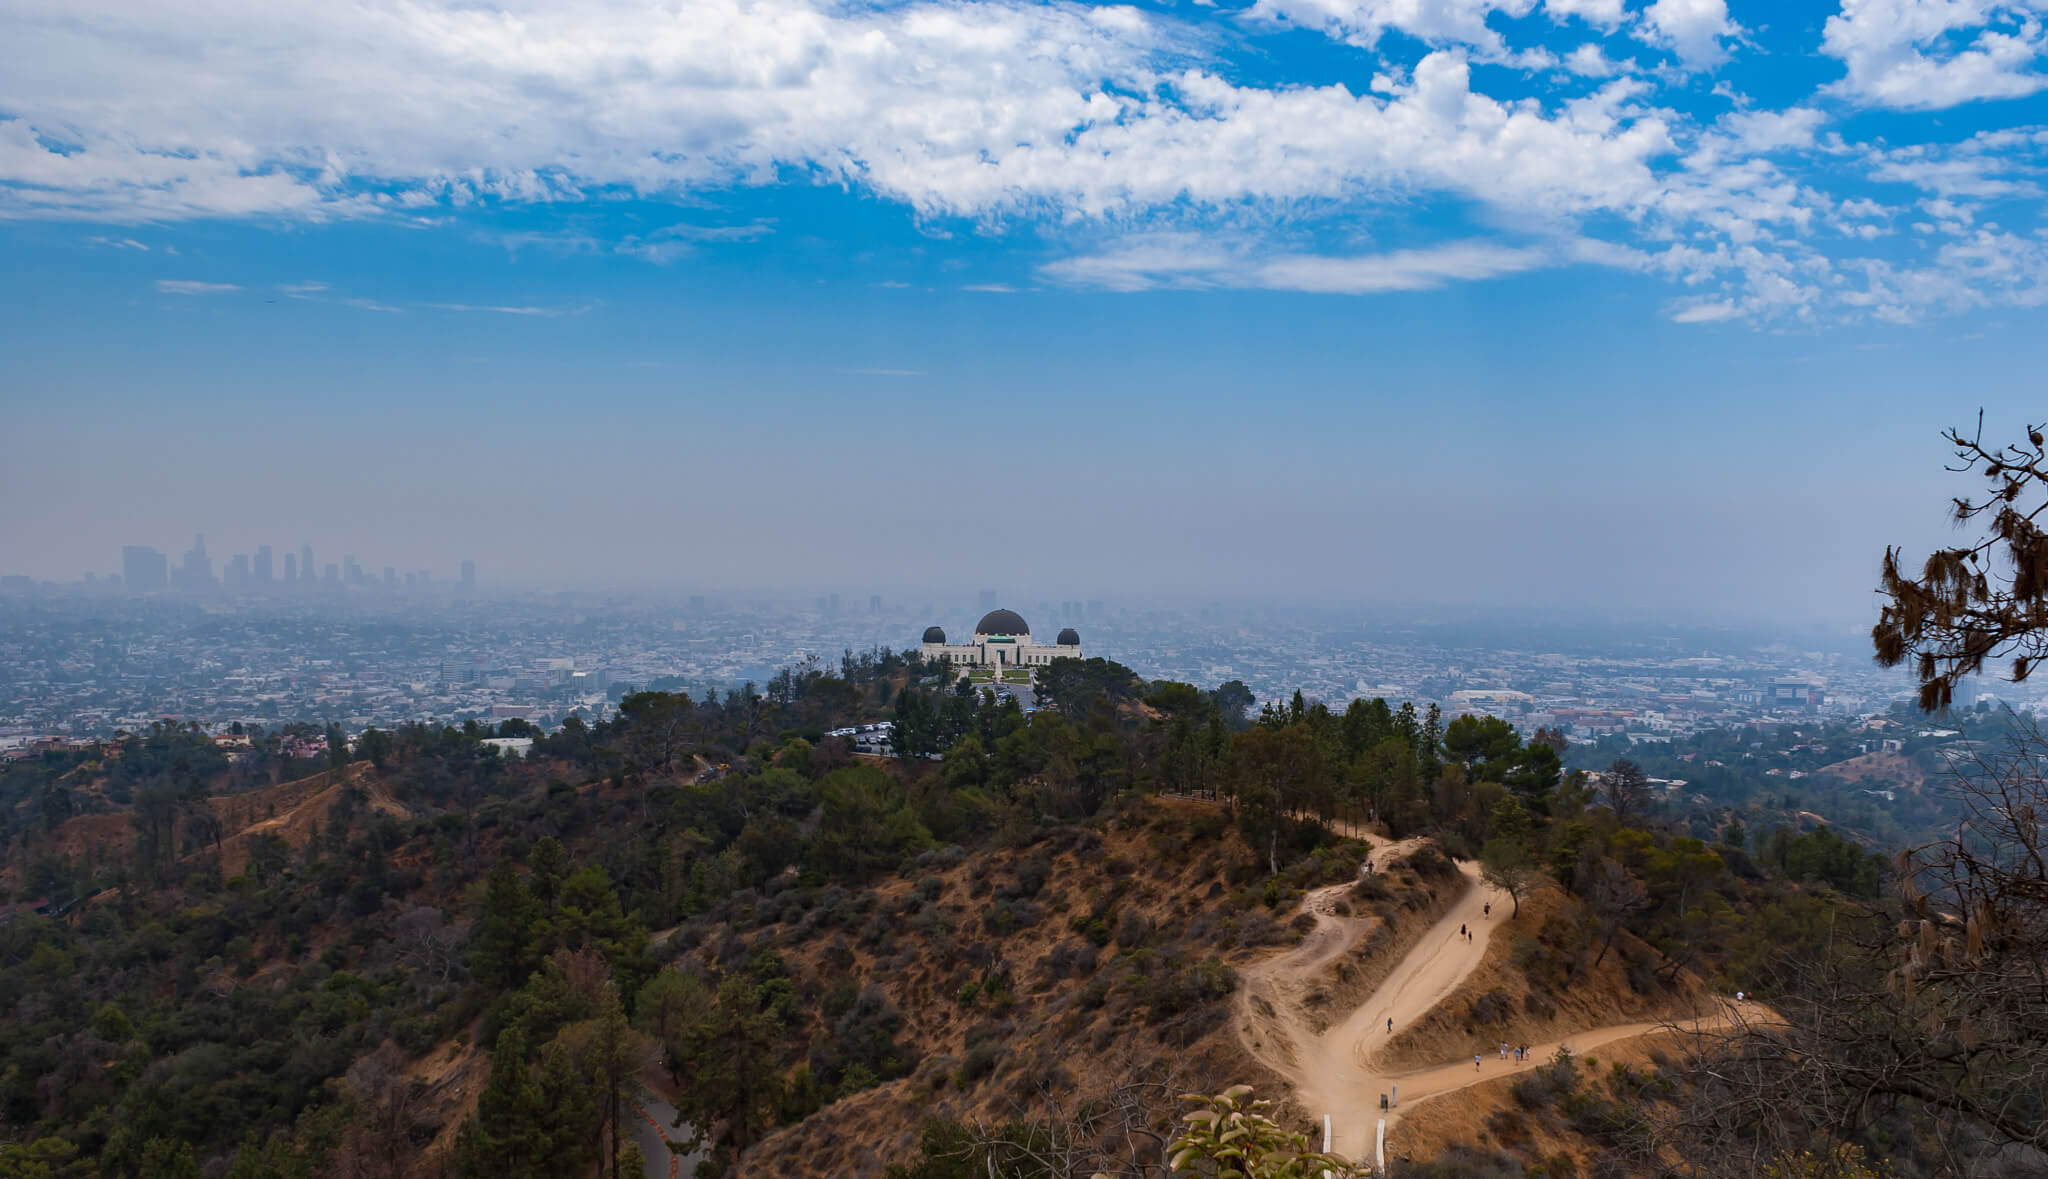
At a trailhead, an Urban Post PYRO counts visitors entering and exiting the park.
Before launching their count program, park managers never really knew how many people used the park. Estimates about how visitors were entering and exiting the park were based on anecdote and assumption and managers could only guess how many people were in the park at one time.
A robust system for tracking and analyzing data
For the LA Department of Recreation and Parks, good data analysis and communication were an important component of their count program plan from the start. For parks managers, Eco-Visio – our interactive online data analysis platform – is the tool for the job. As soon as the counters were installed, the team setup an extensive dashboard in Eco-Visio to capture baseline volumes and trends from across both parks in a click of a button. Standardized dashboards are used in order to get the latest key trends each time they login. In particular, the Department is most interested in the daily counts, previous day counts and monthly averages, in addition to usage trends across different park access points.

Park managers see all of the latest trends for each park as soon as they login to Eco-Visio.
For the Department, transparency is the goal. Beyond internal reporting, data is regularly shared with various staff either through their Eco-Visio page or using the built in ‘download a report’ function. Eventually the Department aims to release their own public, interactive dashboard to more widely share the count data.
Robust data, one year later
So, nearly a year into their count program, what has the data shown? What have park managers learned about how and when the parks are used? Let’s take a look at a few key trends.
First, as you may expect, both Runyon Canyon and Griffith parks are more visited on the weekend than during the week.

In addition to being more well used during the weekend, the way people use the parks is also different during the week compared to the weekend. Let’s look at the hourly usage profile for Griffith Park, for example. If we plot the distribution of counts by hour throughout the day, for an aggregation of counters, we can see that on a weekend the bulk of visitation happens between a 9am to noon peak. During the week, however, visitation is more spread out throughout the day, including a small, evening peak as people get into the park after work.

In the above chart, the Y axis represents the percent of total daily counts, not the raw total counts or average counts per hour. In that sense, it is not that there are more people in the park at 7PM on a weekday, it is that the share of total daily counts is higher. If we now change the Y axis to look at the raw average hourly counts on a weekday vs. weekend, we are reminded that approximately twice as many people use the parks on a weekend than a weekday. In fact, at 9AM on weekend, three times more people are using the park than at 9AM during the week.

How about the monthly trends? In many places, we see significant seasonal variation in how parks are used, with a big drop-off during the winter. With its consistently warm climate, not so much in LA, where park visitation has only varied ever so slightly by month in the last year. The graph below plots total monthly counts in Runyon Canyon Park along side the average monthly temperature.

With such a large park to cover and a limited amount of resources, park managers need data to optimize planning and maintenance practices. Visitation is not even around the park, with park managers reporting significantly higher use in certain areas. For example, two top tourist attractions – the Griffith Observatory and the Greek Theatre – are found at the southern section of the park. Whereas before park managers relied in instinct and assumption to gauge the need for more staffing in these areas, count data now provide an objective understanding of how much more resources are needed in this area for trash collection, graffiti removal and general staffing. The data team and park operations and maintenance team work hand in hand, collaborating to enable a data-driven approach to park planning and management.
The same is true in Runyon Canyon park, where the focus is on understanding entrance and exit trends. Even before the pandemic, there were challenges in both parks concerning the number of people on trails and parking issues.

Data today for the parks of tomorrow
It is quite incredible what the LA Parks team have been able to achieve in the past year. On top of managing the pandemic and ever-changing health restrictions (which at one point lead to complete park closures in Los Angeles), the Department has rolled out an extensive count program to understand how and where the parks are being used, informing park maintenance and overall improving visitor experience.
With all of this data in hand, park managers are adapting today’s park for tomorrow, ensuring that parks continue serve as an essential space for people well into the future.
We are so proud to be part of the story and can’t wait to see what comes next.