Cycling Insights

Cycling Insights is a complete tool for analyzing your bike network, developed in partnership with Geovelo, a company specializing in cycle route planning and GPS track analysis.
By combining quantitative data and qualitative data, it provides detailed indicators about a city's cyclist flows. For example: average speed and distance, origin/destination, desire lines, overall traffic, and more.
Whether to implement a cycling plan, develop cycling policy, or take your cycling network to the next level, Cycling Insights is your one-stop-shop for all the information you need.
CYCLING_INSIGHTS_COMPUTER_ISOCHRONES_EN (1)

Key Benefits

Using a combination of quantitative data and qualitative data, Cycling Insights gives you mastery and knowledge on what is happening on your bike lanes:
    • Visualize bicycle flows street by street, and section by section. See where trips start and end, their desire lines, the number of trips per day, and isochrone maps.
    • Identify the busiest routes, accessibility gaps, and accident-prone areas. See where people go the fastest, where they stop the most, and how long they spend on the road.
    • Measure the impact of construction and improvements on cyclist flows. See where your infrastructure is, where improvements are needed, and how bicycle volumes change after a project.
    • Learn about your city's cyclists. What are their demographics, what kind of bike do they use, and what are their comments about your roads?
PC_CYCLING_INSIGHTS_FLUIDITY_EN
GUIDAGE_MISE_VALEUR_TERRITOIRE

How does it work?

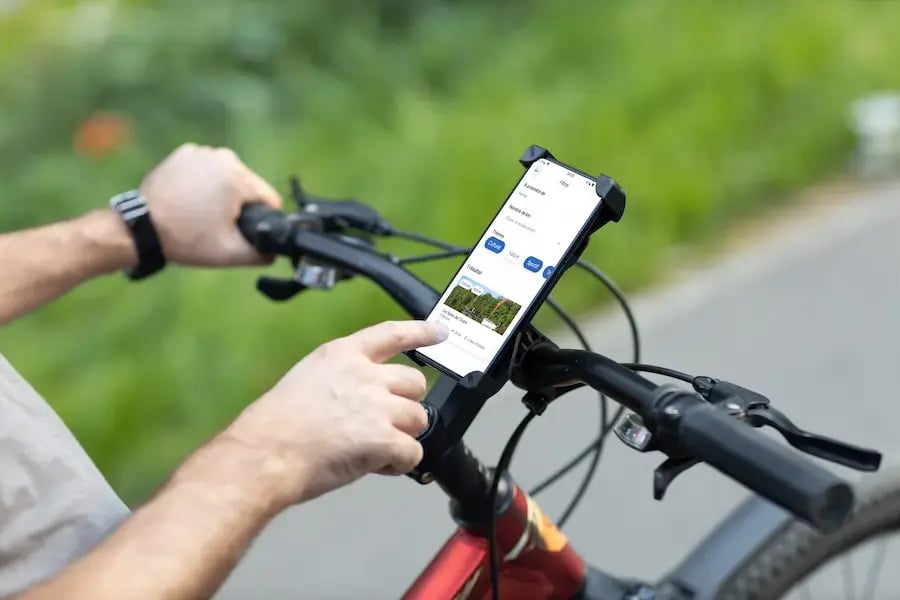
Cycling Insights is an innovative solution that works by merging count data from automated counters and GPS tracks (quantitative data) with user-generated data from the Geovelo app (qualitative data). The Geovelo app is a free route mapping app for cyclists.
This generates information for improving your cycling plan or changing cycling policy such as:
    • Traffic trends

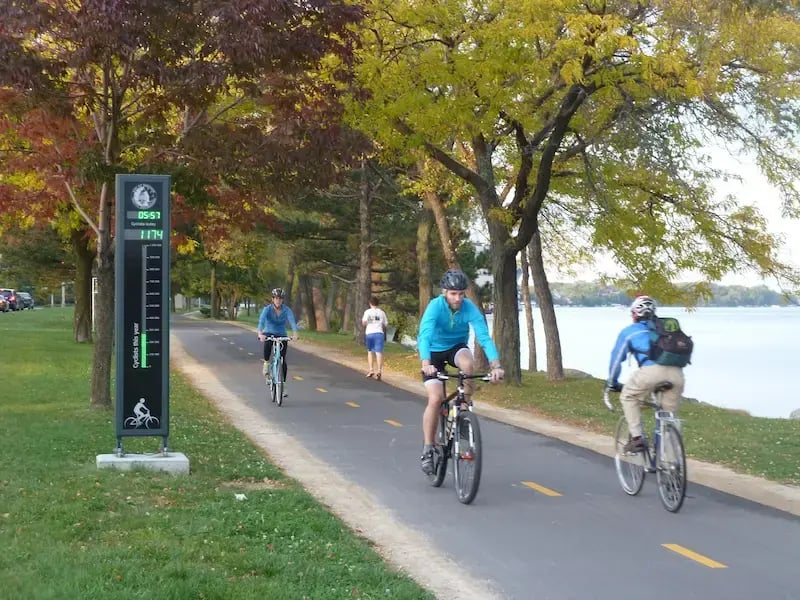
    • Number of trips per day

    • Number of stops per mile

    • Impact of weather on traffic

    • Speed, distance, and average trip duration

    • Locations with reported need for infrastructure or maintenance


Why use Cycling Insights?

AdobeStock_91225542-1

An integrated dashboard for analyzing cyclists on your network

Once collected, the qualitative and quantitative data from the Geovelo app and automated counters are integrated into your Cycling Insights platform. This lets you view and analyze all the information in one place for a complete diagnosis of your cycling network.

 
URB_08-August-City of Madison

Open up two-way communication with cyclists in your city

In the Geovelo  app, cyclists can give feedback on bike facilities, pointing out where they think repairs or bike lanes are needed. This data goes into Cycling Insights and shows up on your map of cycling facilities, creating dialogue between you and your city's cyclists.

 
AdobeStock_1111645666 (1)

Inspire and promote cycling in your community

In addition to cycling indicators, the Cycling Insights solution makes it easy to interact with the cycling community via the Geovelo app. You can suggest bike routes in your city, post news on infrastructure updates, and promote bike-related events and tours.


Product suggestions