
That being said, here are 7 tips for effective pedestrian and bicycle count data analysis!
How does a bicycle/pedestrian counter work?
To start off, it might be useful to revisit how bike and pedestrian counters work. There are different technologies that exist, but the ones we’ve used for over 20 years (which have been effective in environments all around the world, from busy urban streets to large national parks) are:
- Induction loop technologies for cyclists – which detect metal using magnets
- Pyroelectric sensors for pedestrians – which detect heat using infrared beams
- Cameras with algorithms and artificial intelligence for multi-user counting
Find out more about how our systems work in our dedicated article.
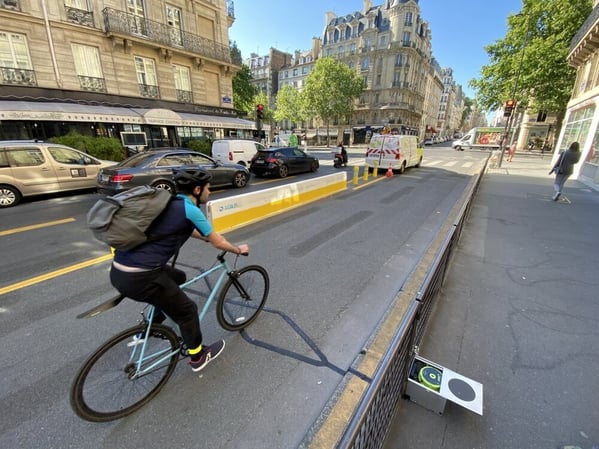
A temporary bike counter with induction loops (Easy ZELT) – Paris
What’s the difference between a "counter" and a "counting site"?
Another important piece of knowledge is the difference between a « counter » and a « site/count site. »
A counter refers to the physical equipment, whereas the count site refers to the geographic location where the physical equipment is positioned. In many instances, it is possible to move counters from one location to another, and therefore from one « site » to another. As such, the traffic measured and presented in reports represents a « site, » and not necessarily a counter, as multiple counters could have counted for the same site.
Tips for pedestrian and bicycle count data analysis
Now that we’ve revisited some basics about counters, let’s look at count data analysis. Automated counters are an excellent source of longitudinal data that reveals trends and growth. However, to be accurate when analyzing pedestrian/bicycle traffic, it is important for you to be aware of the possible external causes of changes in traffic levels, as well as other effects when making conclusions about the data.
Causes of changes in count numbers
#1 Consider weather effects on cyclists and pedestrians
While automobile traffic is generally very predictable, cyclists and pedestrians are more sensitive to the weather. Winter periods are traditionally weaker in terms of traffic, and meteorological events can have an impact on ridership.
Many recent studies have looked at these effects, revealing things such as:
- On trails, daily average temperature was the most important variable affecting demand for pedestrians and cyclists. Interestingly, cyclists were more sensitive than pedestrians to factors like temperature, snow, and average wind speed. (Source: University of Minnesota)
- On weekends, cyclists on off-road trails were less likely to be affected by weather than cyclists on bike lanes. On weekdays, the inverse was true. (Source: Science Direct)
- In a study on 40 public bike share systems in 16 countries around the world, bike share usage increased as temperature increased, but only to a plateau point where usage then began to drop off. (Source: Velo)
To get the full picture from your pedestrian and bicycle count data analysis, it is important to have consistent weather data, or least to isolate the impact of weather on an increase in counts. For this, cross-referencing count data with weather data can help (See the weather analysis module integrated into our Eco-Visio solution).

#2 Remember calendar effects
Public holidays can also have a significant impact on traffic. In urban areas, for example, a public holiday in the middle of the week can lead to a drop in pedestrians and cyclists, whereas in rural areas, a public holiday in the middle of the week can lead to an increase. This potential impact on ridership should be taken into account when making comparisons with previous years.
#3 Monitor roadwork or changes to the traffic plan
An easily identifiable major cause of count data variation is the closure of an arterial road for roadwork, which almost systematically leads to a change in ridership. In other words, construction work will inevitably reduce the number of people using a facility, though these people could be taking an alternate route that isn’t being counted. Make sure to take this into account when comparing pedestrian and bicycle traffic on a regional scale. In other words, ask yourself: Did my analysis include the sites that were open and available during the period I'm studying?

#4 Take note of the "cycling network" effect
On a more positive note, the creation or improvement of cycling networks can result in misleading count data reductions. The development of a new, more suitable, or more direct facility can lead to reduced traffic on other facilities. In cities where a complete and continuous cycle network is being built, you should cross-reference count data from permanent counters with other data sources, such as GPS tracks, to obtain a complete view of the network. This can be done on a large scale with our new Cycling Insights solution, developed in partnership with Geovelo.
-1.webp?width=600&height=450&name=CYCLING_INSIGHTS_COMPUTER_ISOCHRONES_EN%20(1)-1.webp)
Comparing count sites correctly
#5 Only do comparisons with complete data
Before comparing a site’s data between two periods, it’s important to ensure that the data set is complete and does not have any anomalies over the periods being analyzed. For example, if you wish to compare the years N and N-1 for a counter that is missing ten days of data in year N, the comparison should exclude these ten missing days for both years, N and N-1. This way, only the common periods between the two years is taken into account for the analysis.
This implies that the more complete your data set, the better. That said, anomalies or missing data can only be detected by looking at your data at a granular level (ideally by hour and by flow). It’s easy to see why: A counter that supplies data for all 365 days of the year might appear very similar to one that had missing days of data when looking at annual numbers. If we only focus on the total number of passages recorded for a year, data gaps become invisible, leading to inaccurate comparisons.
On the same note, a dip in the data may follow an abnormal rise, creating a false impression of stability in the counts. When we take a closer look, the numbers could easily tell a different story.
#6 Think about the type of cycling facilities being compared
When analyzing ridership, it’s important to know the nature of the cycling facility: is it one-way or bi-directional? Does the facility have one or more lanes (e.g. a shared lane, a dedicated lane separated from traffic)? Care should be taken when comparing "absolute" traffic figures between sites, to avoid comparing sites with different layouts and configurations.

Two-way cycle track in Montreal, Canada
#7 Look at growth rate, not just total counts
Aggregating the number of pedestrians or cyclists passing through several sites to communicate a "grand total" is a good starting point. But, it’s far from the best data you can share! That’s because it doesn’t say much about the evolution these practices. In fact, it really only reflects the number of counters installed multiplied by the average traffic.
As such, it is more honest and meaningful to communicate the average number of counts at a site and the evolution of this number from one year/month/week to the next (integrating all the causes/limitations mentioned above). Alternatively, as we do for our analysis of bicycle traffic in 15 countries, you can use a base 100 representing, for example, the average traffic for one year, which lets you to compare locations with different traffic levels using a common baseline.
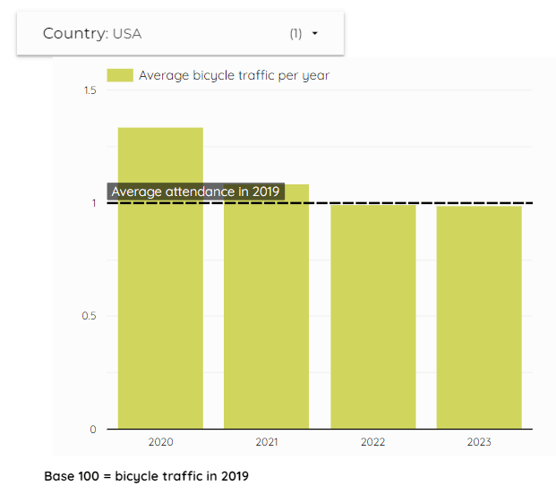
USA average bicycle traffic from 2020-2023, with 2019 as base 100, according to Eco-Counter Index figures
Finally, it’s worth noting that a 10% increase is different for site that gets 100 counts/day versus one that gets 1200 counts/day. So, it may be relevant to mention the average traffic on the site in addition to the % increase.
About our data services
At Eco-Counter, we provide expert data services tailored to your needs. Whether you need custom reports, data validation, data reconstruction, or an estimate of annual or seasonal volumes from short-term counts, we can help.
Beyond data collection via our physical products, we offer a wide range of services that can help you better understand your data.
Here’s how we can help:
- Our data validation and reconstruction services ensure the accuracy and reliability of your data, so you can share your results with confidence. Using our proven methodology, we validate the consistency of your datasets, reconstruct data where necessary, and communicate the results to you transparently (including our level of confidence in the results obtained).
- We can also create specific reports to provide detailed analyses of your data, giving you the information you need to make the right decisions, including weather data.
- In addition, we can also help you estimate annual or seasonal volumes by extrapolation from short-term counts. This is a valuable tool for gaining a better understanding of your network with fewer resources. This is especially relevant for large national parks, where the area being studied is vast.
Contact us to find out how we can help you make sense of your data!