In article one of this Big Data and Automated Counters series, we introduced big data and automated counters in transportation planning, policy, and design. We also learned about their main advantages and reviewed their drawbacks.
Now, let’s look at:
- What you can do with fused data
- What experts in the industry think of the two together
What is data fusion?
According to the Transportation Research Board, data fusion is defined as: "…the process of integrating multiple data sources to produce more consistent, accurate, and comprehensive information than that provided by any individual data source."
Strengths and weaknesses of big data and automated counters – Revisited
Automated Counters:
- Provide continuous, unbiased, ground-truth data.
- But, to fit in a budget, might be limited in how much of a transportation network they can cover. There are also limits to the type of data it can collect (e.g. No origin-destination, demographic information, etc.).

Big Data:
- Comes from GPS, mobile data, etc. and provides complex insights that can cover entire transportation networks.
- But, doesn’t represent all user groups (e.g. Only people who download an app, people who own smart phones, allow apps to run in the background, etc.). It might also lack reliability in areas with lower volumes of users, which could contain facilities that need extra attention.

What data fusion unlocks for you
When you combine big data and automated counters, you get information that is reliable, comprehensive, and extremely in-depth. Big data gives you complex insights on your network and count data benchmarks it to make sure that everything you see is grounded, validated, and representative.
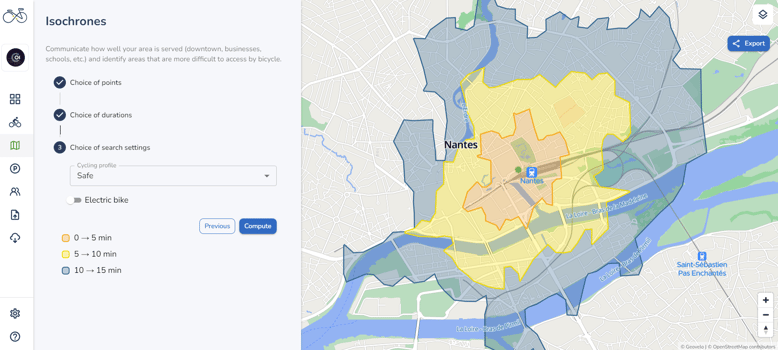
An example of isochrone analysis from Cycling Insights.
A key point that ties the two data sources together is that count data (i.e. ground-truth data) is used to inform big data and validate their outputs. On the other hand, big data brings count data to the next level with context and deeper insights.
In other words, big data can give you detailed information on your network. But, without count data to support it, this information lacks reliability and might not reflect what truly happens on your network.

When you combine big data and count data, you can:
- Fill gaps in transportation infrastructure and serve vulnerable groups (e.g. Children/youth, underserved neighborhoods, etc.).
- Present data with confidence and communicate to stakeholders in an interesting, credible, and insightful way. (e.g. A public web page or an infographic like the one we made for the University of New Orleans.)
- Identify high-demand facilities inclusively, using quantitative (e.g. mode shift, origin-destination) and qualitative (e.g. demographics, user profile) indicators.
- Assess changes over time for entire networks and provide concrete evidence about the impact of new facilities on ridership/commuting.
- Improve understanding of crash data and high-risk zones to identify the best places for safety improvements for pedestrians and cyclists.
- Understand where investments in walking and biking infrastructure are needed most using ground-truth data.
A Canadian case study
See how the third largest city in British Columbia combined bike-share data and bike count data to estimate average daily counts on their network (case study here).
What academia says about automated counters and big data
What kind of research has been done on the topic of big data and automatic counters? One study from Portland State University (PSU) tackled this topic head on.
An introduction to the PSU study
Led by Dr. Sirisha Kothuri of Portland State University and supported by a pooled fund grant from the National Institute for Transportation and Communities (NITC), a 2022 study looked at data fusion techniques to estimate bicycle volumes for a transportation network.

The set-up for the study was as follows:
- The goal was to find how to integrate bike count data and third-party data to give the best picture of bicycle volumes on a network.
- They chose six study sites: Portland, Bend and Eugene, Oregon; Dallas, Texas; Boulder, Colorado; and Charlotte, North Carolina.
- They looked at 5 sources of data: Count data, Strava, StreetLight, bikeshare data, and static data.
What the study found
Their study concluded that, in general, adding two data sources together was more accurate than any data source on its own.
Other important takeaways:
. “… rather than replacing conventional bike data sources and count programs, big data sources like Strava and StreetLight actually make the old “small” data even more important.” .. “… low-volume sites were the hardest to accurately predict. One researcher, Kate Hyun of UTA, stated ‘We will need more ground-truth counts for low volume sites to capture the variety of locations, and that will make more robust models.” .
Learn more
If you’re interested in diving deeper into this study, here are resources for you:
- Watch their 1-hour YouTube webinar
- Watch their Research highlight video
- Read their article on the study
Conclusion

To end article two of this series, here are four key takeaways:
- Automated counters and big data sources work together to deliver a complete picture of your active transportation network.
- Each data source makes up for the weaknesses of the other so that you can get better insights and data.
- Academic research shows that data fusion between big data and count data yields better results than either source on its own.
- Informed planning using big data and count data can vastly improve your network. It is also crucial for the safety and well-being of your most vulnerable user groups.
Now that we’ve gone over the combination of automated counters and big data, see our final article for an interview with a data expert on data fusion (coming soon!). Specifically, learn why combining the two sources is the key to a true, effective understanding of active transportation networks.