5 lessons from the analysis of cyclists' speeds
A near-perfect profile
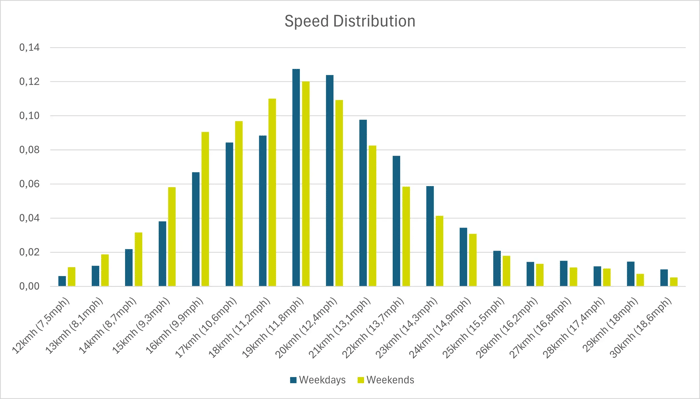
The first striking thing about this analysis is the almost perfect curve formed by cyclists' speeds. Over a large number of measures, we can see a convergence towards a harmonious curve. The vast majority of cyclists ride quietly, at an average speed of 12mph. There is little deviation from this average, with no peaks of low or high speed.
Few differences between countries despite different contexts
It's also worth noting that, despite the diversity of cultural contexts governing the use of bicycles, particularly electric-assist bicycles, people in France, Germany and Sweden travel by bike in very similar ways. This study was based on hundreds of counters in Austria, Canada, Germany, Luxembourg, Spain, Sweden, Switzerland & the USA.
Are cyclists riding too fast?
The overall analysis reveals that 40% of cyclists ride at less than 12mph on weekdays, a figure that rises to over 50% at weekends.
This average speed conceals major disparities: in the morning, cyclists ride faster to get to work or drop their children off at school. In the afternoons, speeds drop, as cyclists are more likely to be out and about. Cyclists travelling at more than 7mph represent 12% of the total at 7am, but only 5% at 2pm.
Cyclists ride faster on weekdays than at weekends
The average speed recorded is 13mph on weekdays, compared with 12mph at weekends, confirming the tendency for cyclists to ride more slowly on weekends, for recreational or leisure purposes.
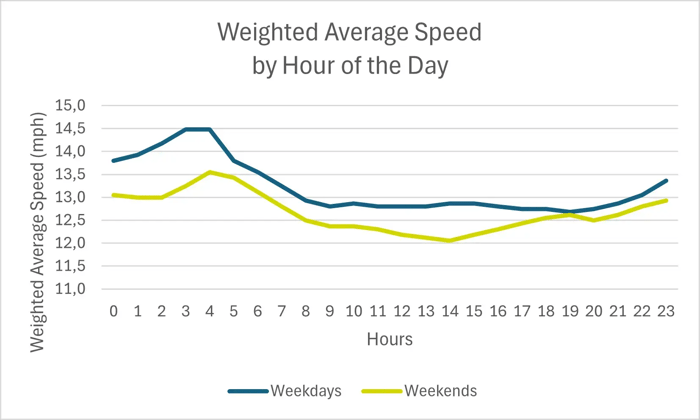
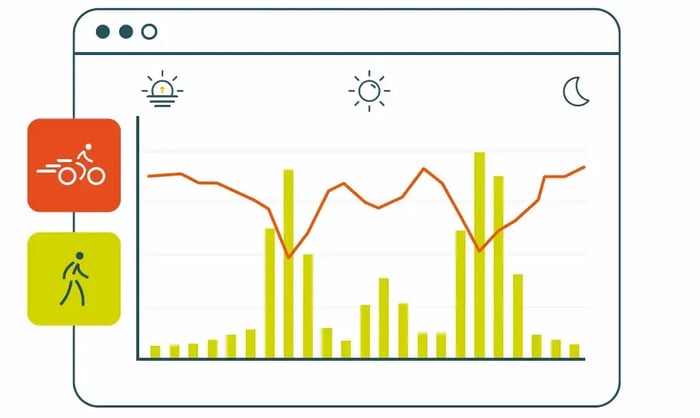
A speed peak in the...morning?
An analysis of speed by hour (weighted by frequency) shows that cyclists tend to ride fastest between 3am and 4am, then slow down on average. This behavior seems correlated with the overall frequency of use of the facilities: the busier the path, the lower the average speed. The reduction in motorized traffic at night probably also enables cyclists to ride faster.
Interested in finding out about cyclist speeds in your area?

Reduce conflicts of use through data collection and analysis
Collecting, cross-referencing and analyzing speed data enables to check for the effectiveness of speed limits, to detect areas of conflict, and to reassure local communities based on facts rather than feelings. They are useful tools for technicians and elected representatives to make informed decisions.
Speed limit for e-scooters in Grenoble (France)
In France, the speed limit for electric scooters and VAEs is 15mph (25km/h). In Grenoble, a measurement campaign showed that around a quarter of scooters exceeded this limit, meaning that the vast majority complied with the regulations (source: www.ledauphine.com/transport/2024/10/03/a-grenoble-25-des-trottinettes-roulent-trop-vite).
The measurements provide a factual response to comments such as "scooters are all going too fast".
If a large number of users exceed 15mph (25km/h) on a given road: target controls, review road sharing, reinforce signage. If the majority respect the limit: focus on cohabitation (facilities, markings, communication) rather than solely on repressive measures.
On each road, the speed profile helps to prioritize public policies between :
-
a simple reminder of the speed limit,
-
an enforcement campaign,
-
or a modification of the road layout.
Cities that have reduced motorized vehicle speeds
Reducing the speed of motorized vehicles is one of the most effective ways of protecting vulnerable road users (pedestrians, cyclists, scooter users).
The risk of death for a pedestrian hit by a motor vehicle falls sharply between 30mph and 20mph (50 and 30 km/h). (source: https://ville30.org/le-concept-de-ville-30/30-kmh-et-securite/).
- The lowering of the speed limit to 80 km/h (50mph) on the French secondary road network has reduced the number of deaths on the roads concerned (source: https: //doc.cerema.fr/Default/doc/SYRACUSE/15639).
- In Paris, the 50 km/h (30mph) speed limit on the ring road has already been accompanied by a reduction in accidents, traffic jams and noise, according to initial assessments by the City of Paris and the Atelier parisien d'urbanisme (Apur).
- Many large cities that have implemented 30 km/h (20mph) (Paris, Grenoble, Lille...) have observed a reduction in accidents and gains in quality of life (noise, comfort for pedestrians and cyclists).
Here again, speed information from different users is invaluable in making the right decisions:
-
Before the measure: choose where to lower the speed limit.
-
After the measure: check its real effectiveness and adjust if necessary.
The right adjustments for each lesson learned
Observed speeds vary greatly depending on the context:
- a shared layout with high pedestrian use naturally reduces cyclists' speed,
- a wide, straight lane, on the other hand, encourages faster speeds.
Speed data can be cross-referenced with the number of pedestrians and cyclists on the road, allowing to see where speeds are not compatible with the desired use of the road:
- Take action on intersection design
- Choose between dedicated or shared spaces
If speeds remain high despite the presence of pedestrians: consider separating the flows (dedicated cycle lane, wider sidewalks). If bicycle speeds are naturally moderate: a well-signposted shared space may be enough.
The right data for the right decisions
Data on cyclists' speed helps us to better understand their needs and design safer, smoother cities.
In concrete terms, for a local authority, speed data can be used to :
- Adapt curvature radii and lane widths where speeds remain too high.
-
Choose between shared or separated spaces, depending on speeds and pedestrian traffic.
Would you like to use this data for your projects?
Beyond the numbers, get a complete tool for measuring, analyzing and acting to develop and secure active mobility in the city, transparently and efficiently.

FAQ
Why do some cyclists seem to ride fast?
A perceived high speed may conceal an unsuitable layout (lane too narrow, reduced visibility). Our data shows that only 5% of cyclists exceed 15mph (25 km/h) in normal conditions. Rather than penalizing, let's improve the infrastructure!
How to interpret high cyclist speeds?
If the average speed observed in your area is over 12mph (20km/h), there are several possible explanations. A high average speed may indicate a comfortable track width, favorable topography, good pavement condition, or even specific uses such as deliveries or bicycle couriers.
Cross-referencing this information with the number of users will also tell you whether the high speed is linked to low cycle or motorized traffic.