.webp)
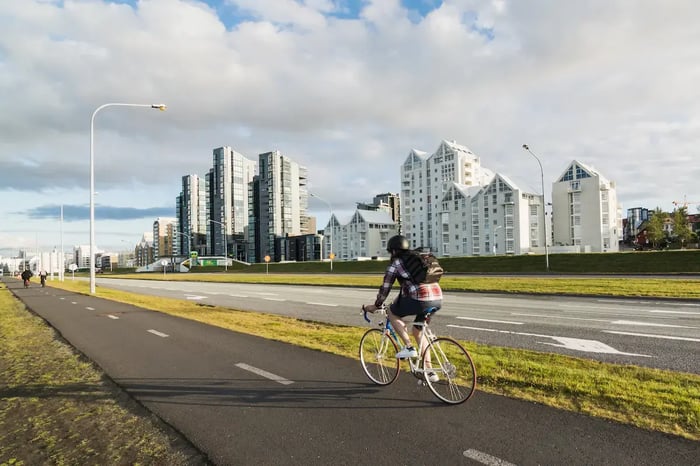
Our Data Services team recently explored an innovative way to demonstrate the bicycle traffic recorded by our various counting systems. The result? Graphs that could be described as "data art"!
These offer a novel way of visualizing cycling activity by hour of day and day of the year on a global set of counters.
This visualization highlights key patterns at a glance, such as:
- Differences between cities where cycling is mainly used for commuting and those where cycling is more for leisure.
- Weekday vs. weekend usage trends.
- Seasonality in cycling.
- Impact of holidays.
Reading key:
- On the horizontal axis, each point corresponds to a day in 2024.
- On the vertical axis, we find the hours of the day.
Each cell represents a specific hour and day, colored according to the average number of counts recorded at that hour, for all the city's counters.
The colder the color, the lower the average number of counts, and conversely, the warmer the color, the higher the average.
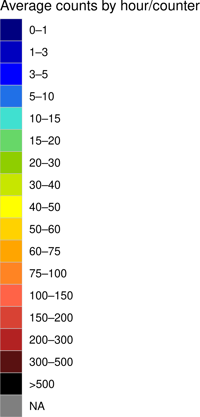
Legend for the graphs below - associating average hourly traffic with color.
The color scale is standardized between the different cities, allowing us to make visual comparisons. That being said, it's important to note that comparing hourly averages between cities is not entirely relevant. Indeed, the number of counters available and their specific location in each city strongly influence the average counts.
Nevertheless, with this representative sample of counting sites, it becomes possible to visualize variations in cycling activity, draw out interesting facts, and highlight cultural specificities for each city.
Here are a few examples!
PARIS (66 bicycle counters)
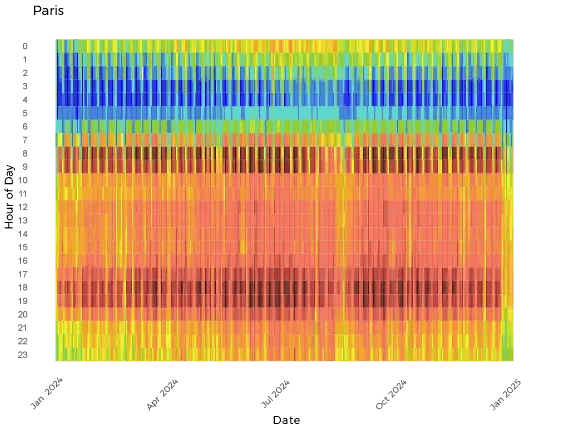
Paris cycles all year round, but remains influenced by the seasons and weekly patterns.
- Bike trips are particularly high in the mornings and evenings - commuting journeys - and tend to fall on weekends (on the graph, this is reflected by dark red rectangles, from five working days, separated by lighter green slivers from two days off).
- Parisian cyclists also ride in the evenings, especially in the summer, when the days get longer: the red cells stretch from the evening into the early hours of the morning, proving that bicycles are also used for nighttime outings.
- Attendance drops off in August and December, in line with the school calendar - a true French signature. The Olympic (July 26 - August 11) and Paralympic Games (August 28 - September 8) have also left their mark.
NEW YORK (21 bike counters)
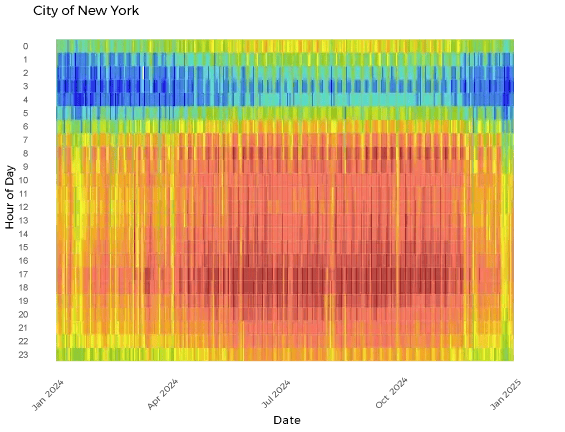
New York, true to its reputation, is bustling and busy all year round. However:
- The number of passages is lower in winter, but as soon as the fine weather returns, the trend changes. Bike counts gradually increase until they become almost homogeneous: the differences between mornings and evenings, weekdays and weekends, fade away. It's non-stop!
- Unlike Paris, there is no marked effect of school vacations, with the exception of Christmas in December.
- Like in Paris, evening cycling increases during the summer. Nightlife by bike is alive and well in the Big Apple.

MONTREAL (38 bike counters)
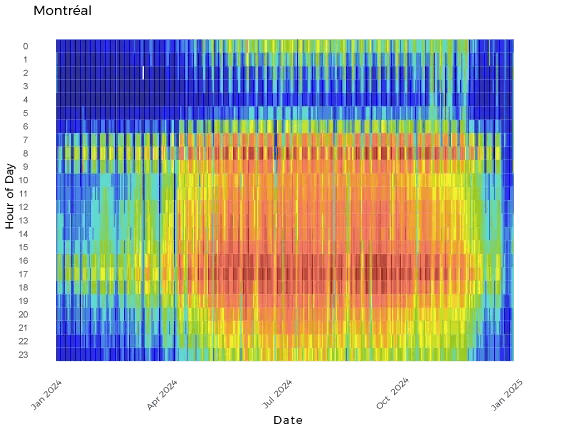
Montreal, a city of bike lovers, lives and rides to the rhythm of the seasons.
- Montreal winters are not kind to cyclists. Ridership drops sharply during the cold months, but commuter traffic tends to hold steady, with winter retention rates rising year over year (for more on winter cycling in Montreal, see this article!).
- From the start of spring, traffic gradually picks up again. The differences between morning and evening, weekdays and weekends are clearly visible - a typical signature of utilitarian/commuter bicycle use.
- Curiously, the evening rush hour in Montreal is between 4 pm and 5 pm, whereas in Paris it's between 6 pm and 7 pm. A question of culture... or work/life balance?
AUCKLAND (18 bike counters)
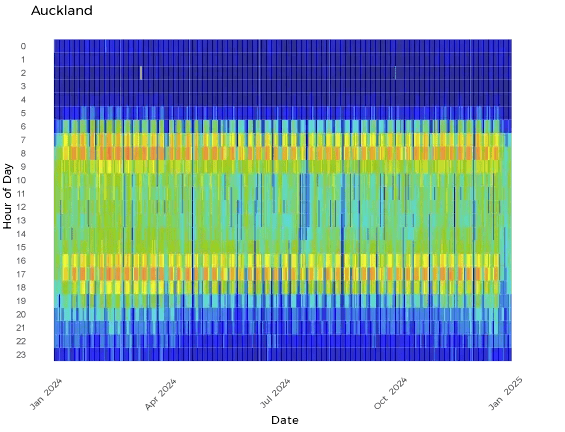
Auckland, in the southern hemisphere, shows no particular trend in bicycle use over the year.
- Like other major metropolises, Auckland cycles all year round, even if the volumes remain more modest.
- Seasonality is reversed: ideal pedaling conditions extend from late December to March, and cyclists take advantage of this. On the other hand, evening and night-time cycling is virtually non-existent, even at the height of summer. A question of culture? Or perhaps it's the layout of the city that makes cycling less attractive as a mode of transport at this time of day?
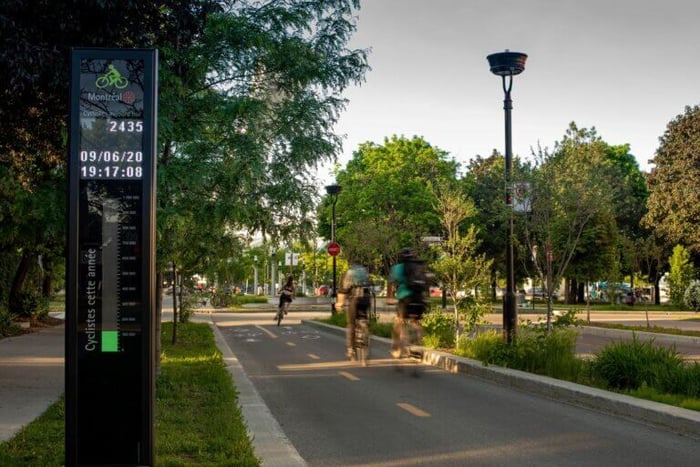
 The city's iconic "Lightpath" bike path has been a massive success since its opening,
prompting the city to communicate this success with creative ideas!
REYKJAVIK (23 bike counters)

Further north, in Reykjavík, things are also rolling.
- Despite a population much more modest than that of the other cities observed, bicycle use in Reykjavík is clearly utilitarian. Commuting to and from work is very important, even in winter.
- In the summer, the number of trips increases, with journeys lasting until 10pm. In July and August, ridership drops slightly, perhaps a sign of summer vacations.
PUNTA ARENAS (13 bike counters)
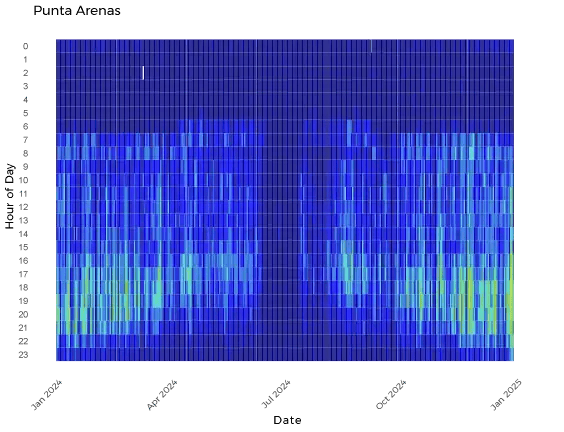
At the tip of Chile, Punta Arenas perfectly illustrates the seasonal nature of the southern hemisphere.
- Winter, which runs from late May to August, marks a pause in cycling activity - just when, in the north, most cities are experiencing their annual peak.
- Overall, the number of bicycle passages remains low throughout the year. But we do see an increase during the austral summer, from December to March, on par with Montreal's volumes during summer nights.

Interested in getting this kind of graphic/visual for your counting program?
Contact us, and we'll be happy to help! Or, get the visuals above in PDF format.