Analy usage data (ridership, speed, accidents, etc.) via the Cycling Insights platform
The Cycling Insights dashboard makes it easy to analyze ridership by section, see the fluidity of bicycle traffic, and generate Origin-Destination matrices.
By analyzing ridership, it is possible to see the absolute number of passes recorded for a given period. You can also apply filters to display the most frequented sections, for example.
The total kilometers traveled over a given period is available, and cross-referencing this data with information on cycling facilities (see previous article) also reveals the percentage of journeys made on dedicated facilities, whether safe or not.

One function also makes it possible to overlay flow data with the locations of physical counters installed in the region, and to have direct access to the data from these counters.

Speed analysis
Cycling Insights also makes it possible to analyze cyclists’ speed, with a calculation of average speed and an analysis of speed by section. This is a useful feature for precise diagnosis of future needs in terms of cycling facilities, and for potential conflicts of use.
Here too, a filtering tool is available to quickly identify the roads with the highest or lowest speeds.

Origin-Destination matrices
Another useful feature of Cycling Insights is the ability to easily generate Origin-Destination matrices from usage data. This makes it quick and easy to identify the most frequent routes and the neighboring cities with the strongest connections to the city center.
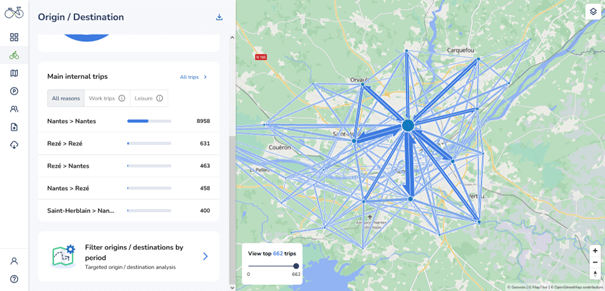
Visualization of origin-destination matrices.
Crash data and reports
Another feature enables you to easily consult crash data and reports, from several data sources:
- National Observatory for Road Safety
- Reports via the Geovelo application
- Sudden braking (collected automatically via the Geovelo application)
Once again, this data can provide useful information for diagnosing and reflecting on cycling facilities.
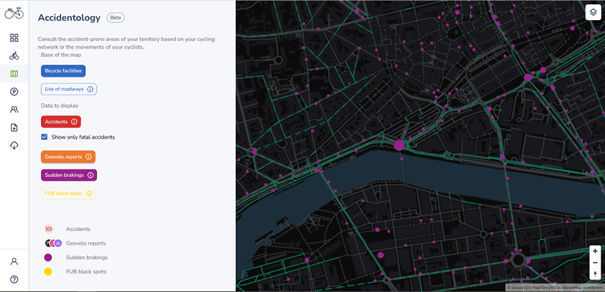
Example of visualization of sudden braking, to identify potential accident-prone junctions
Want to find out more about Cycling Insights or see a demo of the solution? Contact us now!
Read our previous articles on Cycling Insights:
Read our next articles on Cycling Insights: