For more than a decade, AT has relied on data analysis based on cycling usage data (notably the number of bikes recorded on key corridors) to measure the real use of cycleways, make sense of the data, and make results visible.
In a context of public debate, conflicts over street space, and sometimes significant budget pressure, these figures become a reliable indicator to interpret results. They are also used to present budgets, make decisions, prioritise projects, and demonstrate impact.
Challenges
Before automatic counting, AT had to invest with limited evidence and convince people despite misconceptions. Teams mainly relied on occasional surveys and short-term manual counts, which made it difficult to:
- Prioritise cycling investments in the face of criticism about “empty bike lanes”.
- Measure the long-term impact of infrastructure (seasonality, trends, before/after).
Solutions
AT structured an approach centred on “ground truth”: tracking key corridors over time through a dense network of monitored locations, to better understand a city’s usage levels and quantify changes in cycling mode share.
- 26 historical sites used as references to build long time series.
- Progressive deployment of automatic counters across the rest of the network as needs arise, for a total of 81 equipped sites.
- Centralisation and data analysis via Eco-Visio as an all-in-one solution, with an operational dashboard to support:
- day-to-day monitoring (hours, days, seasonality),
- strategic analysis (trends, mode shift, comparison with other modes).
Results are shared with stakeholders and published monthly: https://at.govt.nz/cycling-walking/research-monitoring/monthly-cycle-monitoring

What the ridership data revealed
Note: This section is based on Matt Lowrie’s excellent analysis (Greater Auckland): https://www.greaterauckland.org.nz/2025/05/29/whats-up-with-cycleway-ridership-the-numbers/
Overall ridership rising again; city centre already back to 2019 cycling traffic levels
Across the 26 historical counters, ridership has been increasing again in recent months, while still remaining below the peak observed before COVID. It is estimated at around ~90% of the record level of February 2020.

On main roads accessing the city centre, the dynamic is clearer: cycling trips are back to levels comparable to 2019, while car traffic and public transport remain durably below. This suggests a relative increase in cycling mode share in this area.
“[These results] are part of the continuation of the investment wave from ten years ago, which improved cyclists’ access to the city centre through projects such as Grafton Gully and Lightpath.” — Matt Lowrie (Greater Auckland)

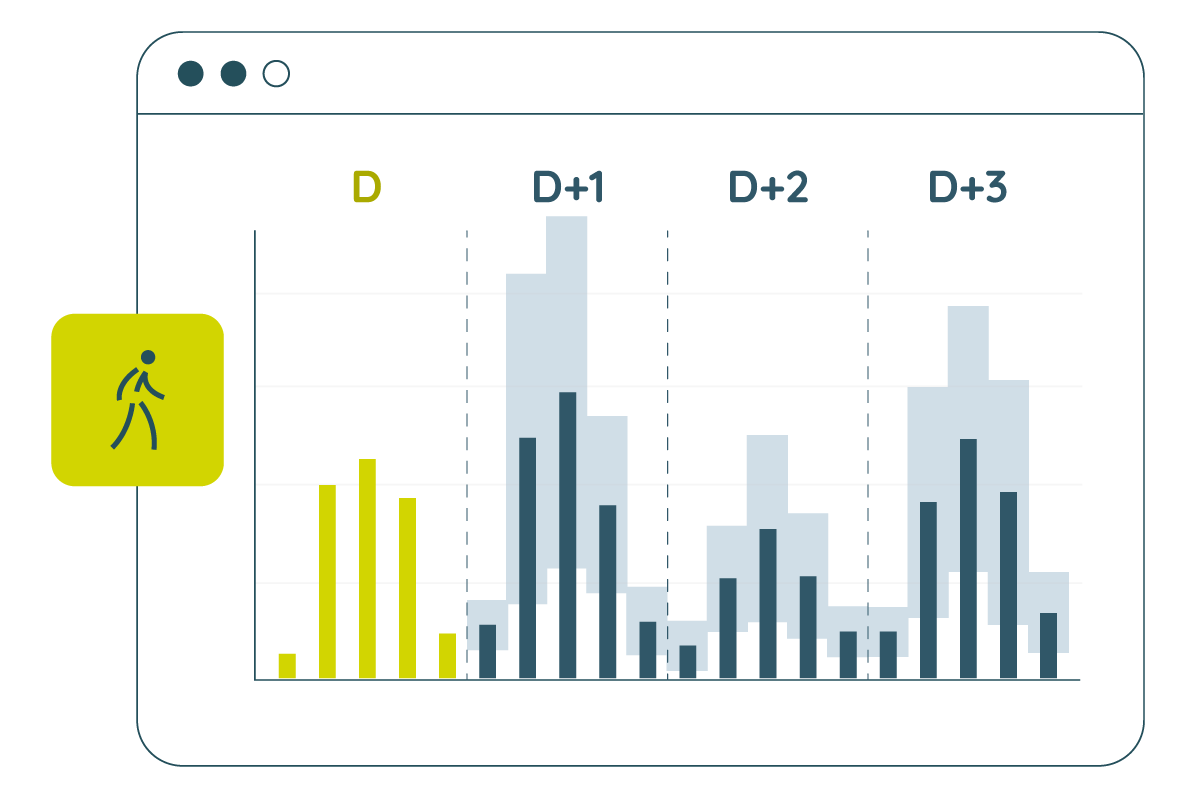
The “network effect”: a key connection can trigger a jump in usage
One lesson stands out: each new cycling connection, even with variable quality, can trigger an immediate and lasting increase in cycling.
A site monitored since 2010 illustrates this: as improvements were made (continuity, safety, connections), ridership increased sharply on this key north-west corridor, with traffic doubling between 2016 and 2020. In 2026, cycling volumes on this corridor are back at levels similar to 2019–2020, although they have not reached the February 2020 peak.
For a visual illustration of this network effect: https://www.greaterauckland.org.nz/2025/05/29/whats-up-with-cycleway-ridership-the-numbers/
Before/after: fast results, quantified
On Meola Road, a corridor redesigned between 2023 and 2025, the counters show 500 trips/day as early as March 2025, i.e. 70% of the 2028 target (700/day). Without measurement, the project could have been judged too early; the data shows a strong start, and an ambitious but realistic target for 2028.

Concrete decisions enabled by the data
As Auckland Transport notes, the organisation uses counting data and data analysis for several reasons, including:
- Understanding cycling usage trends, to make sense of the data and interpret results over time
- Supporting decision-making and investment for cycling policies (notably as part of the cycling plan) and to present budgets on an evidence-based basis
- Sharing data with the general public about how the cycling network is used
AT’s “Statement of Intent” includes key indicators based on counters, and recent reports highlight that usage data has often exceeded expectations (average annual growth of 13%). For AT, these counts provide a reliable, comparable indicator to track the number of bikes, discuss mode share, and support a sustainable mobility trajectory.
In a context of declining national funding for walking and cycling, local trends are used as arguments to maintain or supplement municipal funding for priority projects. Auckland Council highlights the measured increase on new routes to justify continued investment (e.g. +NZ$200M between 2015 and 2018 for +27 km of cycleways).
Key learnings
Auckland’s example highlights three important points:
- Maintaining a core set of “reference” sites over time is key to tracking the underlying trend beyond seasonality.
- Setting a quantified target for each project (e.g., trips/day after N years) strengthens clarity and robustness.
- Contextualising counts (weather, time patterns, other modes) helps produce a more actionable reading of the figures.
Conclusion
This illustrates a simple idea that cannot be repeated enough: ground-truth data turns conviction into decision.
By quantifying real usage, data analysis helps prioritise, justify, and continuously improve a cycling network. And it shows that with continuous links, ridership can increase quickly.