Summary
-
The City of Boulder started their count program in 2019 after realizing they could get more value from long-term trends compared to one-shot visitation studies.
-
Their counting program was built specifically to handle their large, multi-entrance trail network. Using a mix of continuous and short-duration counters, they employed a rotating panel approach that effectively studied over 200 sites.
-
Data insights from their years of counting include: 6.17 million annual visits estimated in 2023, 1.5% per year growth rate from 2023-2025, and minimal seasonal variation between winter and summer.
-
Count data helped the city run a muddy trail closure program, make a smart management decision during the pandemic, and win funding for the Mount Sanitas Trail Project.
A city that embraces active mobility
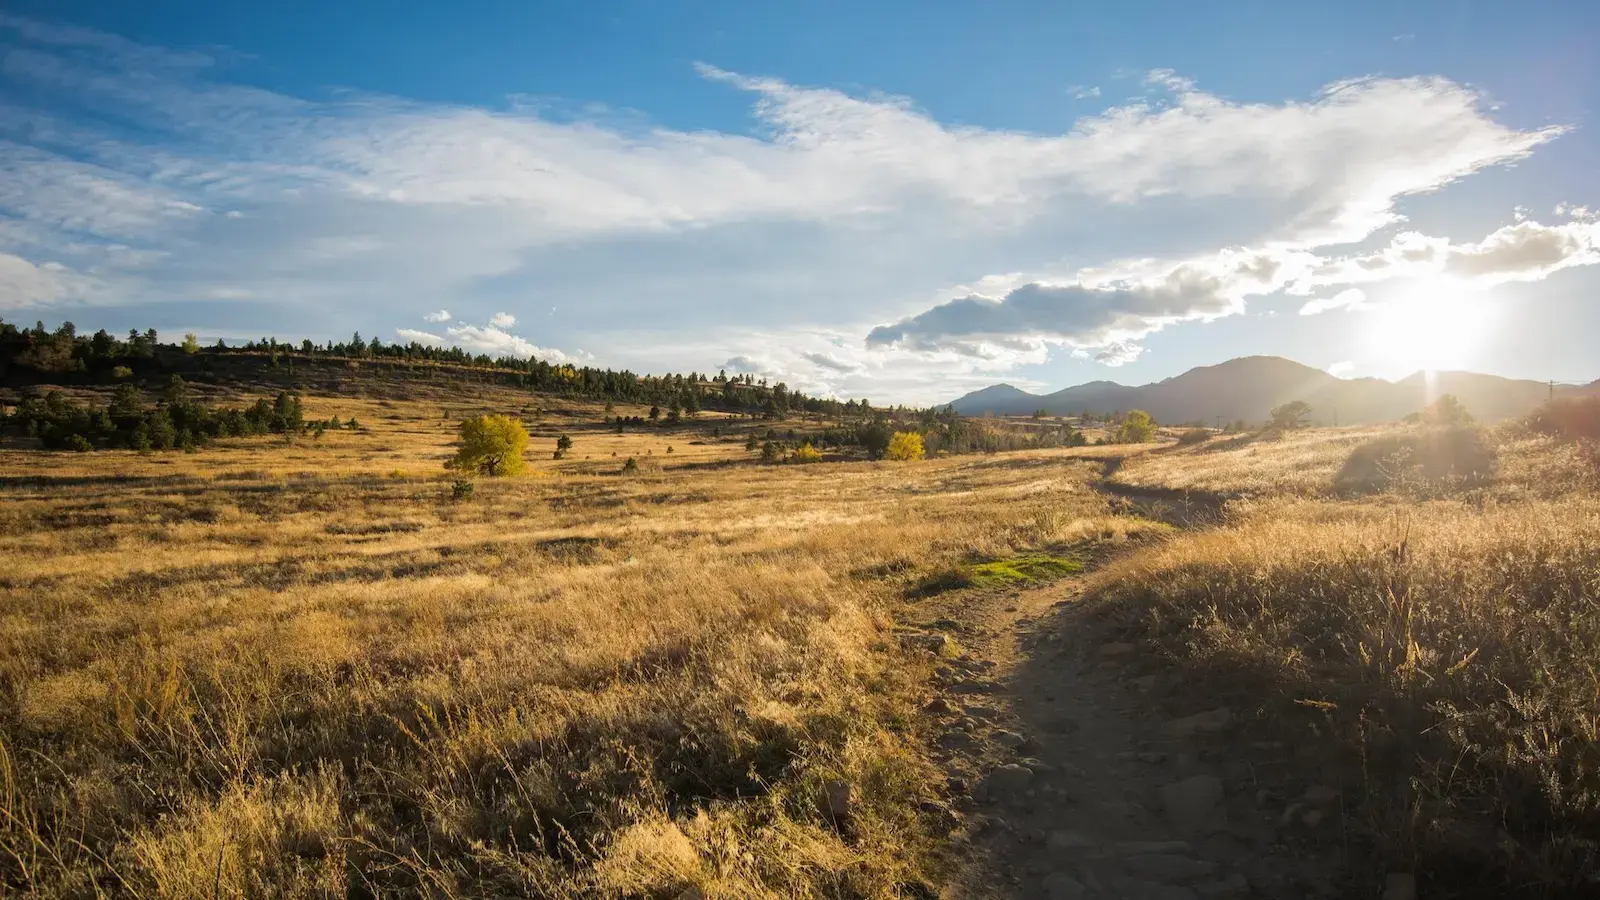
If you want to see a city with high-functioning active transportation infrastructure, look no further than Boulder, Colorado.
Home to the iconic Flatirons, the city's active transportation mode share is the highest in the state at 16.5%. For comparison, the national average sits at about 12%. What’s more, a 2025 municipal report showed that 93% of Boulder residents have access to comfortable walkways, 85% have access to comfortable bikeways, and 74% live in walkable 15-minute neighborhoods.
.webp?width=1500&height=750&name=North%20Sky%20Trail%20Opening%20-%202x1%20(1).webp) Opening day of the North Sky Trail in Boulder. Credit: OSMP
Opening day of the North Sky Trail in Boulder. Credit: OSMP
By all counts, Boulder has enough data to demonstrate the effectiveness of their mobility policies. But the picture wouldn’t be complete without measuring their visitor traffic on trails as well.
Why they decided to collect trail data
Boulder’s Open Space and Mountain Parks Department (OSMP) is in charge of protecting and preserving the city’s natural environment, including it’s trails.
In 2005, OSMP did a network-wide total visitation study on their trails. They did another in 2016. While having total visitation numbers was interesting, OSMP realized that not having long-term data made it difficult to understand patterns and improve their decision-making.
 |
Their strategy to measure visitor traffic on trails
OSMP started their count program in 2019. However, it was a challenge because of how large and porous their network was.
The city’s trails are built on a ring of properties around the city. They include sprawling trailheads and abounding neighborhood access points, meaning OSMP had to decide how to place their counters to cover the most visitors.
 A PYRO counting trailgoers near The Flatirons in Boulder, Colorado.
What was their strategy?
-
They started by gathering a comprehensive inventory of “entry points,” or places where a person could go from one jurisdiction to another.
-
Once these were mapped out, they selected places that converged many routes together or that ran parallel to natural features like creeks or rivers.
-
With their counting locations identified, OSMP used both permanent counters (around 20) and a fleet of temporary, mobile counters to analyze visitor traffic at as many locations as possible.
-
For their temporary counters, they used a rotating panel approach: they randomized 180 short-duration sites into three panels, and assessed one panel each year. This gave them updated data for short-duration sites every three years.
To date, OSMP has studied over 200 counting sites on their trails.

Turning their data into outcomes
.png?width=903&height=413&name=chart%20(15).png)
A screenshot of the Boulder OSMP Department's Eco-Visio dashboard. As they added more counters to their fleet each year, their total counts per annum increased.
Key insights from their count data:-
OSMP used their counters to estimate 6.17 million visits in 2023, a 10.8% increase from their last total visitation study in 2017.
-
A second finding: Their count program revealed their average annual visitation growth. Looking at full year counts from 2023 to 2025, they concluded that their visitor traffic was increasing by about 1.5 to 1.8% per year.
-
A third important trend: Seasonal patterns on Boulder’s trails do not reflect a typical state or county park. Instead of large seasonal variations between winter and summer, OSMP found that people visited at similar volumes year round, with a small dip in the winter.
-
A fourth key insight: While OSMP observes differences between weekend and weekday visitation, the gap is notably less pronounced than in many regional or state parks. Trail activity remains relatively consistent throughout the week.
Tangible outcomes from their trail count data
Justifying their Muddy Trail Program
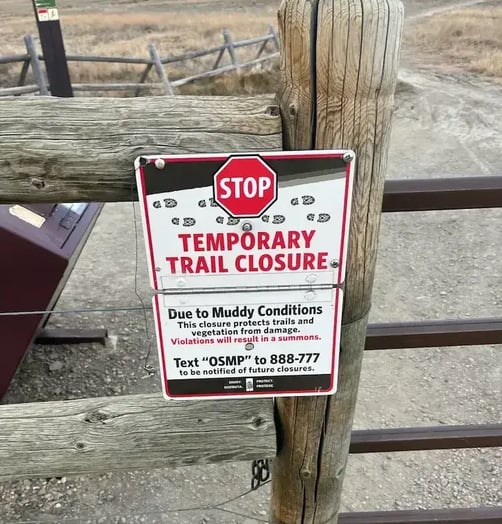
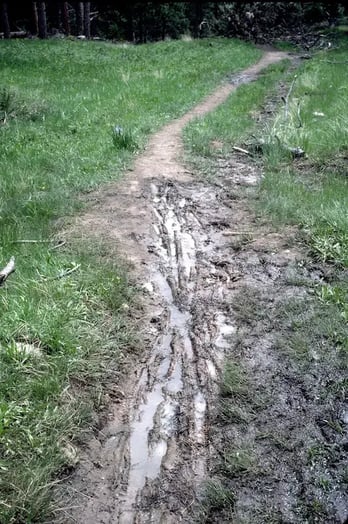
A muddy trail closure sign and the impact of visitation on muddy trails. Credit: OSMP
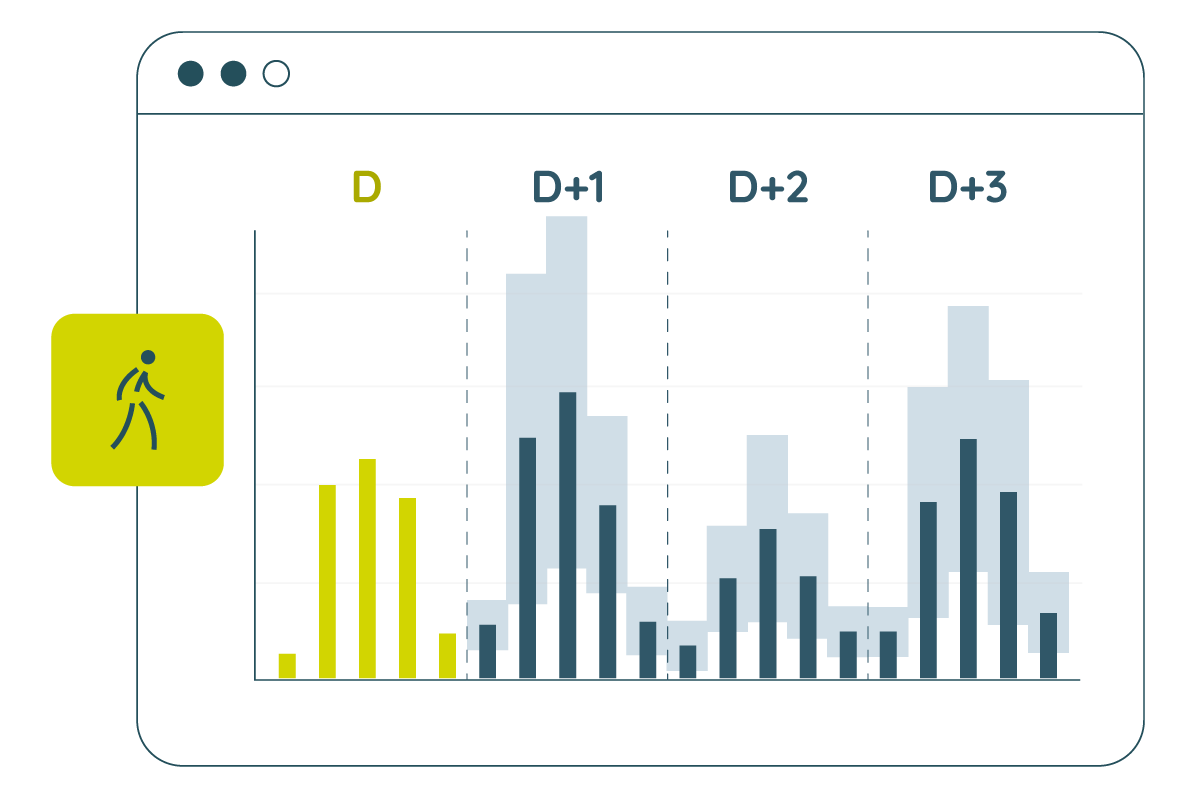
Boulder’s Open Space and Mountain Parks Department runs a trail closure program where certain trails are closed when they get too muddy from weather conditions. This muddy trail program helps preserve the trails but takes significant staff time. So, OSMP asked themselves: “Is the effort of this program actually keeping people off these trails?”
Their count data said yes. A study was done to analyze visitor traffic before during and after the trail closures, revealing an over 90% compliance rate. OSMP also saw visitation shoot right back up once the trails were opened.
This gave management the confidence to say that their program was working, that it was worth the staff time, and also that active management of these trails was necessary. In the future, OSMP plans to leverage count data to identify opportunities for further refining the muddy trail closure program and enhancing its overall effectiveness.
Avoiding mistakes during COVID
Colin Leslie of OSMP told Eco-Counter that count data was “significant when deciding to do something, but also when deciding not to do something.”
The best example of this was during COVID when their trails seemingly exploded in visitation. Most people reported that parking lots were full and that trails were busier than ever. However, the city’s count data told a more nuanced story.
Because OSMP had years of historical data before the pandemic, they could see the full picture of what was happening. Trails in more rural areas were indeed much busier, but trails in the once popular tourist areas were being avoided. Overall, visitation didn’t increase much—it was just redistributed.
Management decided not to act hastily, and over time, they were rewarded with visitation going back to more ordinary patterns as the pandemic subsided. By trusting their count data, OSMP avoided pouring resources into temporary solutions that might have been inefficient in the long run.
Winning a $1.1 million grant for the Mount Sanitas Trail Project
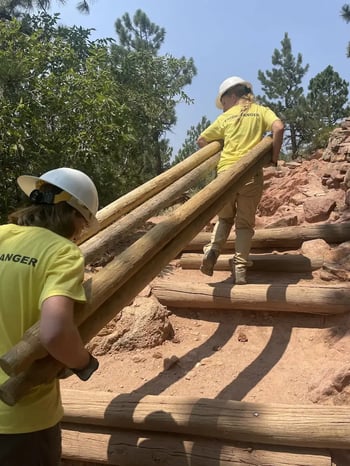
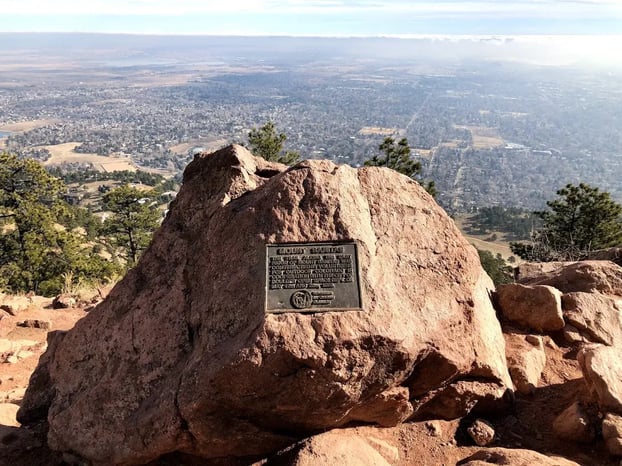
Junior Rangers working on Mount Sanitas trail and the Mount Sanitas summit. Credit: OSMP
The Mount Sanitas Trail Project is an initiative to reverse the wear and tear on one of Boulder's most popular and heavily used hiking areas.
The multi-year project was made possible by a $1.1 million grant from the Land and Water Conservation Fund. Count data played a key role in landing the grant by showing that the trails in the area received around 375,000 visits each year.
Takeaways from Boulder’s Trail Count Program
For an organization looking to analyze visitor traffic or improve an existing count program, Boulder sets a great example:
Don’t panic when selecting count sites
With so many possible sites to choose from, it’s easy to get overwhelmed. Start by thinking about what you want out of your data. For many, it’s to count as many visitors as possible. Map out your area and move forward with a strategy in mind. In Boulder’s case, their idea was to cover junctions and water-adjacent paths, where more people would likely go.
Use a combination of permanent and mobile counters to tackle large areas
The City of Boulder expertly used permanent counters to cover key trails while using mobile counters to expand their study area. When you measure visitor traffic on trails, having mobile or temporary counters gives you the flexibility to change your count locations from season to season. This allows you to adapt your program as you realize which areas are more beneficial to count.
Adopt a long-term mindset
Boulder wasn’t satisfied with a total visitation study every handful of years because it didn’t give them long-term insights. While estimating the number of visitors in one year is a good start, being able to compare your volumes and visitor habits every year is vastly more valuable.
Integrate a survey program
Along with their count program, Boulder’s OSMP Department also ran an extensive survey program. Combining quantitative data (like counts) and qualitative data (like surveys or mobile data) gives you powerful insights for planning and funding applications. In Boulder’s case, they learned about the demographic of people their trails, where visitors wanted new developments to be made, and just how integral these paths were to people’s day-to-day lives.