.webp)
Summary of visitor study
- Annual footfall underestimated: Unexpected peaks identified, particularly on Sunday afternoons, the busiest period.
- +30% higher pedestrian counts on certain days than initially estimated, revealing a stronger tourist dynamic than anticipated.
- Average visit time of 1h33, highlighting the need to extend the on-site experience (services, programming, intermodality).
- Precise geographical origins of visitors, enabling services to be tailored to their needs.
- Attendance data used to secure funding: Support for subsidy applications for developments (station-city pedestrian walkway, signage, parking lot management).
- Optimization of resources: Adaptation of municipal teams and cultural activities to peak hours, particularly on Sundays.
- Concrete impact: Visitor numbers have enabled the launch of structural projects, such as the pedestrianization of the heart of the city, to reconcile tourist appeal and quality of life for local residents.

Challenges
Tourist numbers are high, but for a long time they were difficult to measure, making it difficult to manage operations (programming, safety, services) and justify investments.
The challenge for managers was to get a more accurate reading of visitor flows and their variations (hours, days, season, weather), to guide decisions and preserve the quality of visits and the living environment for local residents.
Prior to the introduction of a more structured approach, the group also faced a number of limitations:
- A partial view of tourist numbers : an existing pedestrian counter owned by the Département de l'Ain (located at the bottom of the town) gave a reliable indication, but was limited to a single site.
- External estimates that were too approximate: cell phone data also provided a trend, but did not allow to clearly isolate the town.
- Contradictory sources between field count data and feedback from tourist operators (which day is really the busiest?).
- Episodes of high visitor numbers (e.g. Christmas market) raise issues of capacity and public safety.
- Maintaining a balance between tourist appeal and the peace and quiet of year-round residents.
Visitor flow analysis solutions
Eco-Counter has enabled to structure a more operational approach, focused on a detailed understanding of visitor flows via the VisitorFlow visitor data analysis solution:
- Measurement of visitor numbers over a period of around 2 years.
- Analysis of visitor numbers, hourly peaks, over-visits, and comparison with the weather.
- Analysis of visitor routes: most frequented lanes and spaces, entry points.
- Geographical origin data to determine where visitors come from.
What the visitor data revealed
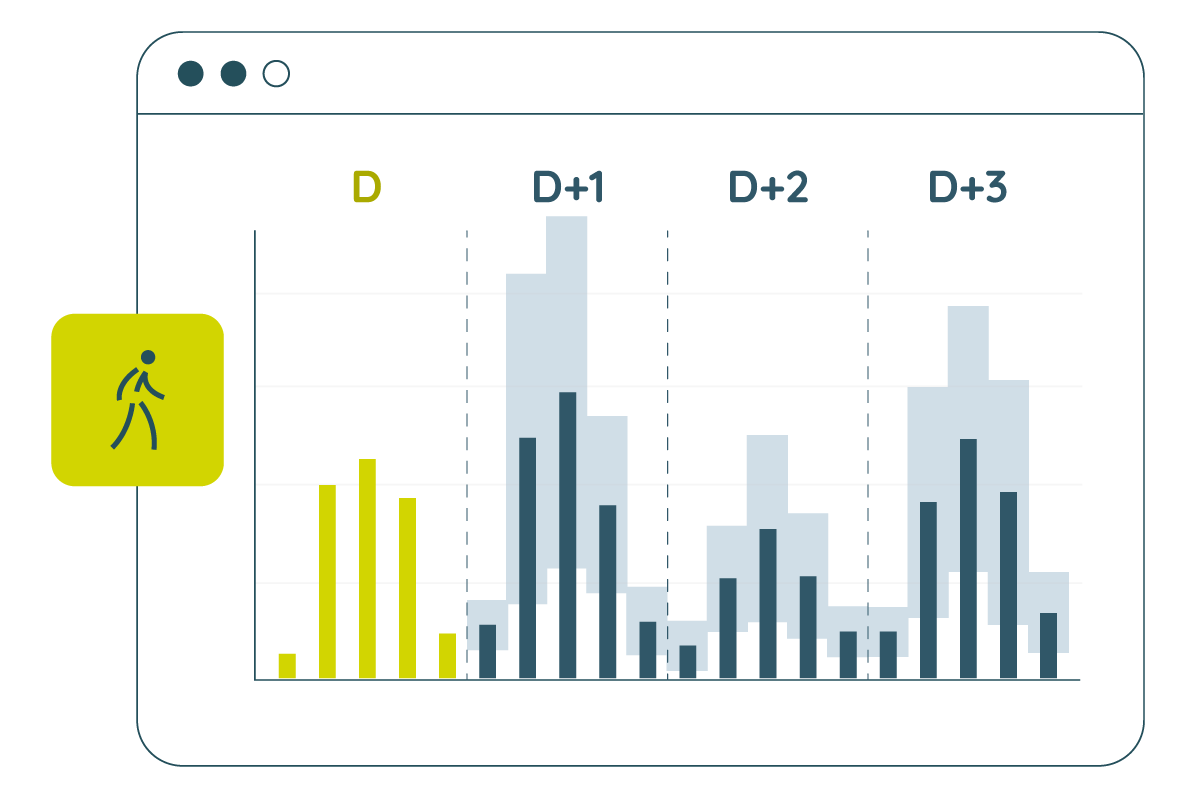
The VisitorFlow study highlighted a central point: footfall was underestimated, and peak periods did not always correspond to initial assumptions. The pedestrian traffic data and results were shared with the various stakeholders involved, providing a common basis for steering tourism policy.
A breakdown by day and time of day shows that Sunday afternoons are very busy in the medieval city, contrary to what other sources might have assumed. The most frequented routes and access points also stand out clearly.
Finally, the data analysis estimates an average attendance time of 1h33, suggesting a relatively short visit and highlighting the relevance of extending the stay (programming, services, on-site experience).
Attendance data also reveals a high turnover of visitors, underlining the importance of better organization of parking, signage and congestion management.

Decisions and actions implemented
The results were used directly to guide decisions and improve site management.
Pedestrian data have been used to support funding applications and calls for tenders for new services (reception, security, public services). Knowledge of the geographical origins of visitors also provides additional elements, notably for the installation of an ATM (automated teller machine).
The analysis of visitor flows and routes has helped to support the request to elected officials for a new pedestrian walkway between the station and the heart of the town, with a focus on active transportation and intermodality (train + walking / cycling). This support is crucial for this project, given the difficulties (land acquisition and strong heritage constraints).
The site's tourism managers were also able to organize free cultural activities for the general public in the most buoyant periods, with the aim of encouraging visitors to stay longer and thus increasing the overall satisfaction rate. Sunday afternoons were chosen as the most popular time slot.
The weekly distribution of visits confirmed the need to adapt the availability of maintenance and municipal teams, particularly on Sundays.
Lessons learned
On a heritage site such as the medieval city of Pérouges, data can be used to better understand visitor flows and fine-tune the visitor experience. Analysis by day and by hour sheds light on sometimes little-known dynamics.
In addition to analysis, this information helps us to transform our findings into concrete action: improvements, organization of access, and consideration of regulatory measures (such as the pedestrianization of the heart of the town) to preserve visitor quality, safety and the living environment.
"VisitorFlow data is extremely valuable to us: it enables politicians, elected representatives and residents to rely on factual, quantified data to answer questions and objectify feelings." Véronique Clerc, Tourism Development Officer