This result is no accident. It is the result of more than a decade of investment, improvement and, above all, fine-tuned management based on real mobility data collected over a long period of time.
To achieve this ambitious Vision Zero goal, the city has combined a detailed understanding of travel patterns, speed reduction, targeted interventions and a reliable data counting and analysis system.
The complex challenge faced by the Finnish capital
Prior to this historic turning point, Helsinki faced a complex challenge.
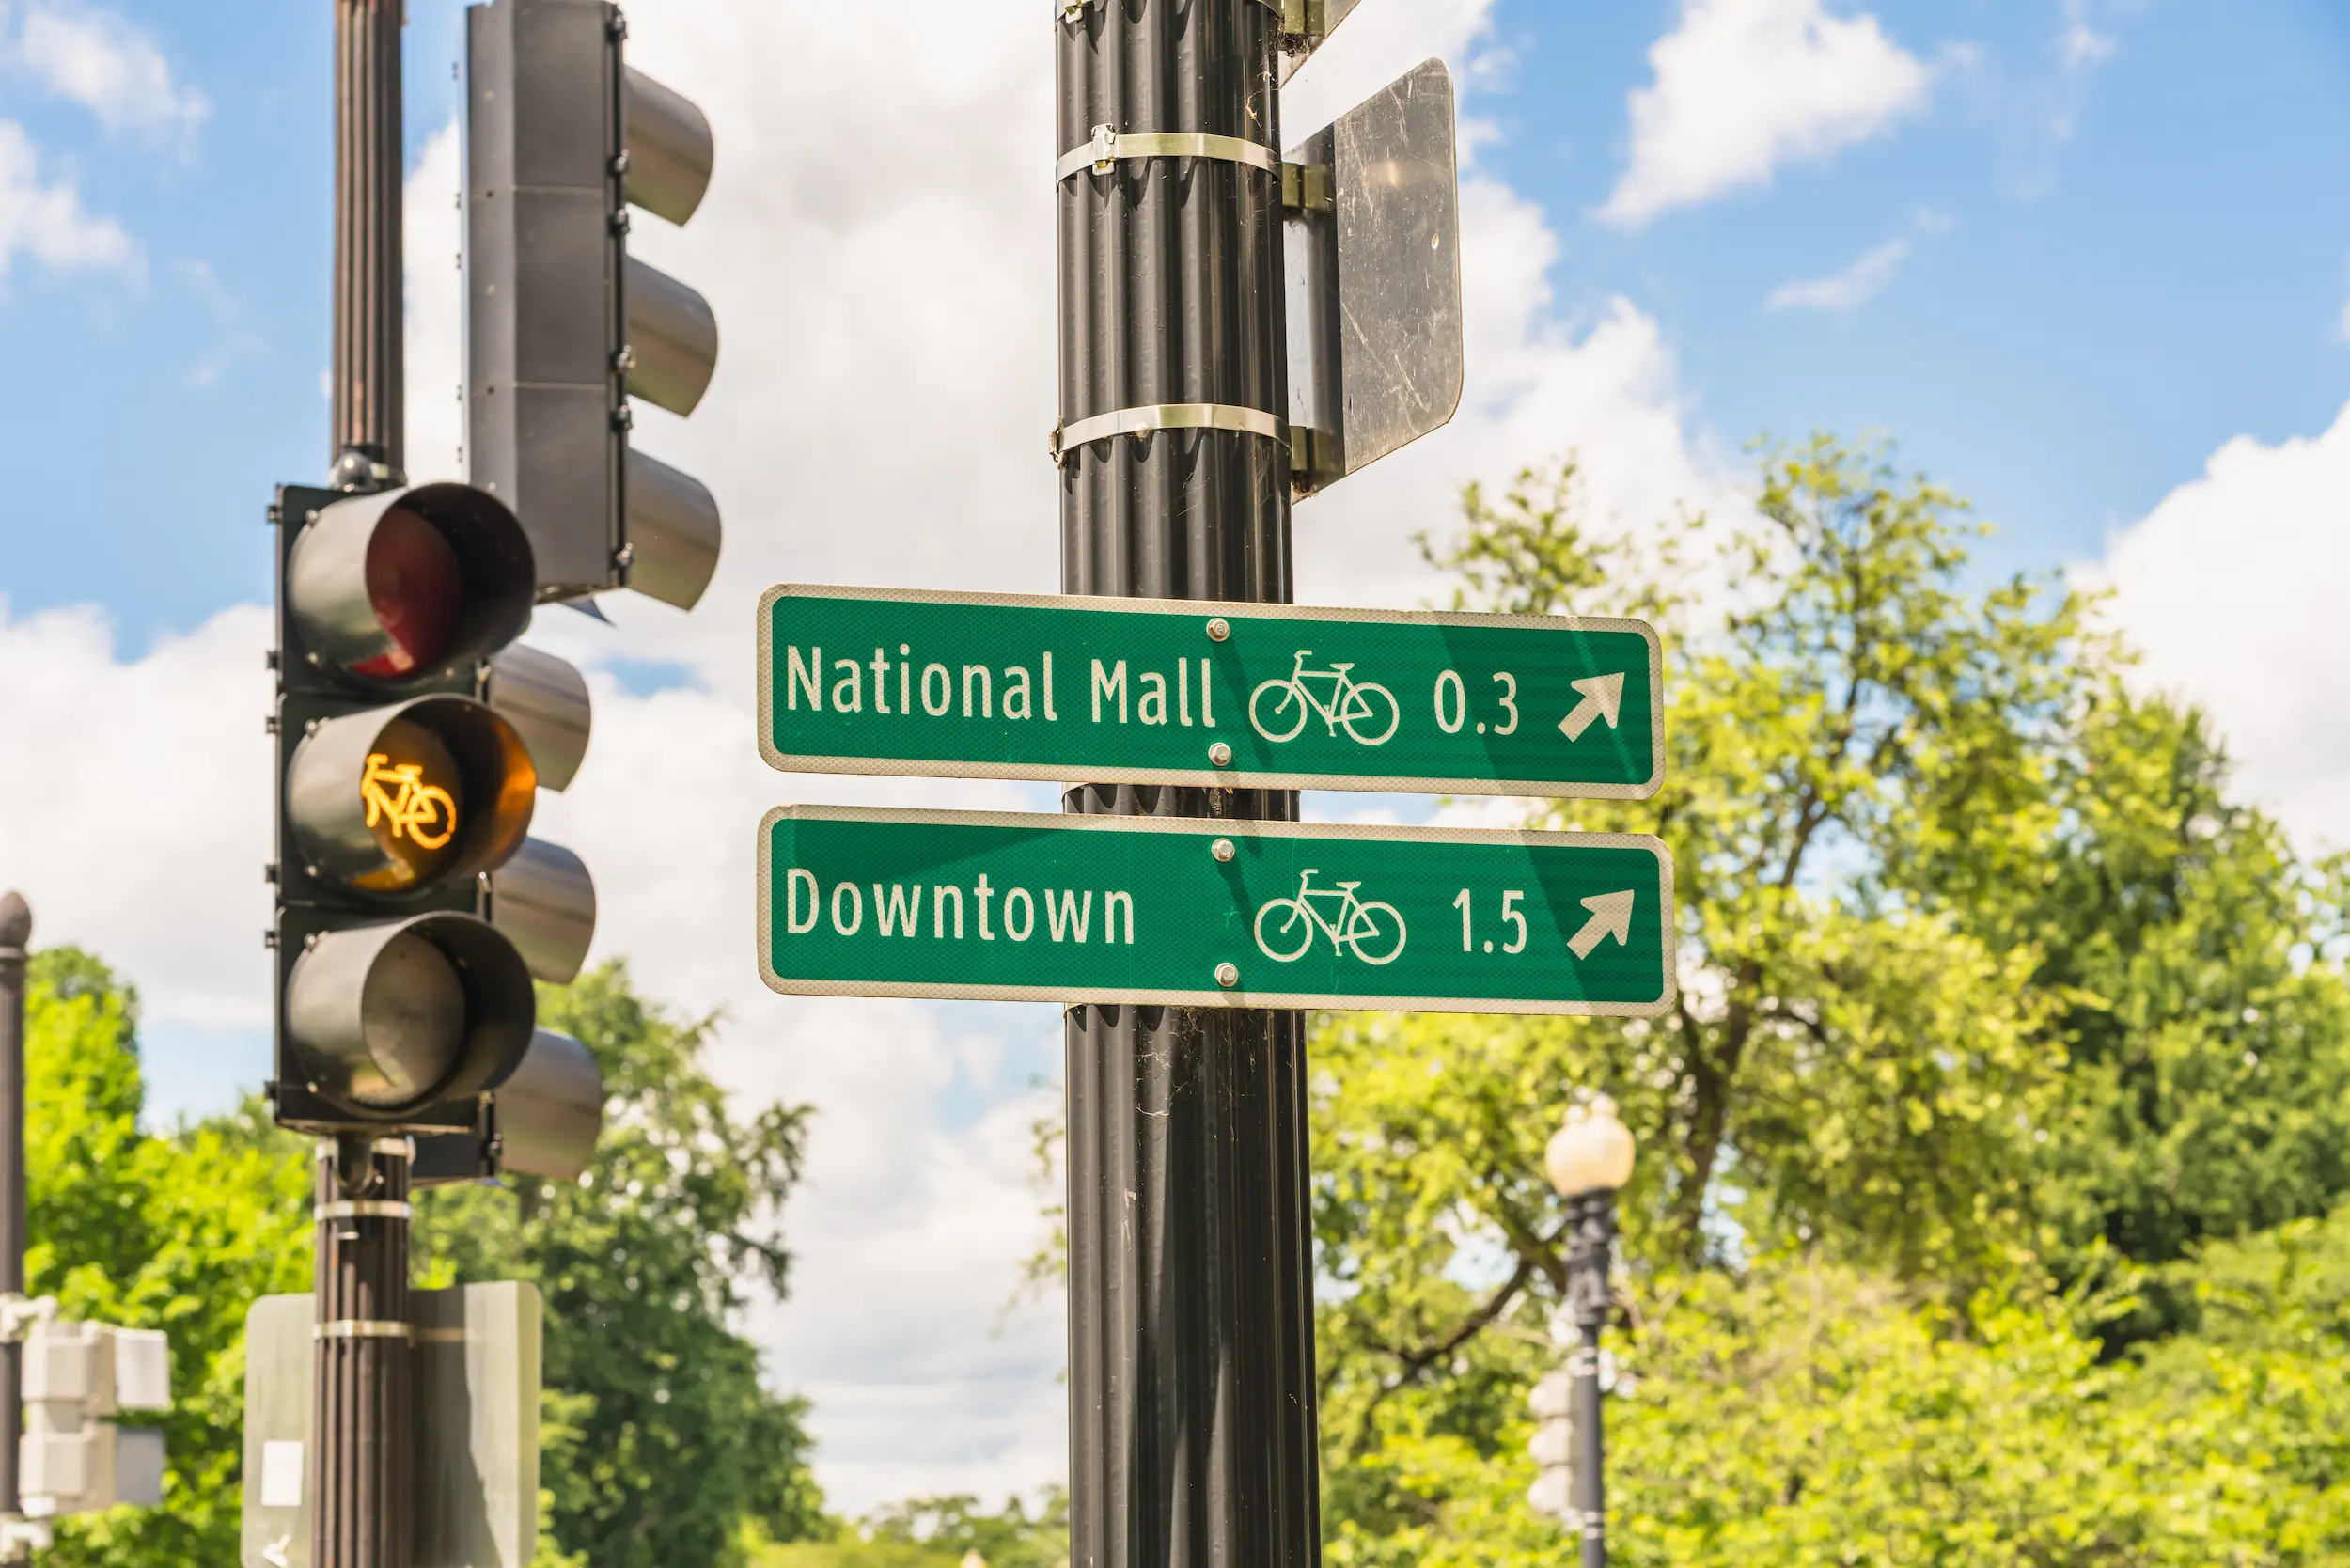
The city had to cope with a demanding northern climate (long nights, icy conditions, rain), growing mixed flows of cyclists, pedestrians and motorists, and steadily increasing bicycle traffic, driven by major routes such as the Baana network of cycle paths.
Despite these transformations, public decisions still too often depended on perceptions, one-off observations or differences between departments. And yet, when it comes to improving the safety of an area, it is not enough.
A number of questions remained unanswered by the Finnish authorities and elected representatives:
- Where were cycling flows most sensitive?
- Which intersections generated the most potential conflicts?
- How did usage evolve between winter and summer?
- Which stretches were most in need of speed reduction or flow separation?
The absence of continuous data increased the risk of wrong priorities, delays in intervention and avoidable accidents. As recently as 2024, the city recorded 277 bodily injury accidents during the year. A figure that had fallen historically, but was still too high to achieve theirVision Zero goal of zero road deaths.
 |
"I always say it's about implementing a well-developed cycling strategy in a holistic way, in conjunction with the city's overall strategy".- Oskari Kaupinmäki, Cycling Coordinator, City of Helsinki - Welovecycling
|
The solutions
To steer its Vision Zero strategy, Helsinki relied on a solid measurement infrastructure and an advanced open data policy, enabling the city to continuously observe its flows and cross-reference different data sources. Here are just a few examples:
A network of automatic counters
The city has a network of 25 permanent automatic counters installed on the main cycling and pedestrian routes, complemented by a public Eco-Display in Lauttasaari, which makes cycling volumes visible to residents and decision-makers. All this data is fed into an Eco-Visio analysis and management platform, including a public version.
.webp?width=700&height=378&name=image(36).webp)
An open data strategy
At the same time, Helsinki is making its complete counting databases available as open data, including an hourly dataset of bicycle counts since 2014 and another set of derived annual data, enabling long-term trends to be analyzed.
These datasets are accessible via the city's official open data platform, and feed into public analyses such as urban planning work.
An API dedicated to mobility data
The city also has an API dedicated to mobility observations, the LIDO-TIKU API, which centralizes flow data from several types of sensor: bicycles, pedestrians, motorized traffic, as well as contextual data such as weather, road conditions or special events. This unified access point enables measured volumes to be linked to actual usage and external conditions.
A management dashboard
By integrating this data into its internal dashboards, Helsinki was able to compare actual volumes between seasons, days, hours and routes, and analyze the impact of weather conditions (snow, rain, frost) on safety and speeds. This cross-referenced data also enabled the company to identify intersections with high usage intensity and cross-reference measured flows with accident reports, prioritizing redevelopments where volumes were highest or potential conflicts most frequent. Finally, internal dashboards were used to assess the effect of 30 km/h zones on injury reduction, thanks to consolidated monitoring published by the city and its partners.
This systemic approach to data created a common language between engineers, urban planners, maintenance departments and elected representatives. Everyone was now working with the same figures, the same dashboards, and a rigorous comparison between actual use and risk levels.
.webp?width=91&height=121&name=image(39).webp)
|
" For us, the important thing is how this objective guides our day-to-day actions (...). We take care to evaluate all our decisions in terms of their long-term impact. " Roni Utriainen, Traffic Engineer for the City of Helsinki, July 29, 2025, YLE NEWS
|
Exemplary results
What the data revealed
The analysis carried out by Helsinki services confirmed one major point. Cycle trips were increasing faster than expected, even in winter. This reinforced the need to improve structuring corridors, to separate flows where volumes were too high, and to make the most complex junctions safer.
The cross-referencing of these reliable data also highlighted :
- sharp peaks in traffic on routes such as the Baana (several thousand cyclists/day),
- a strong seasonal pattern, but a stable winter base, justifying efforts on lighting and snow clearance,
- high-conflict intersections, requiring increased visibility, raised platforms and pedestrian continuity,
- a clear correlation between lower speeds (30 km/h) and fewer injuries on central streets. More than half of the city's streets are now limited to 30 km/h.
These lessons learned have enabled us to transform road safety into a controlled objective, rather than a sudden trend.
.webp?width=580&height=680&name=image(37).webp)
What has changed thanks to this data
Thanks to this approach, Helsinki has been able to :
- Extend 30 km/h zones on a massive scale, particularly in residential areas and around schools.
- Redesign critical intersections to reduce pedestrian/cycle/car conflicts.
- Improve lighting and legibility of active routes during the winter months.
- Separate traffic flows in high-traffic areas.
- Target investments more accurately, more quickly and more effectively.
- Strengthen public support with displays showing counts in real time.
The result is historic. No road deaths over a twelve-month period, between July 2024 and July 2025, confirmed by the European Commission's Observatory and the Finnish media.
The rate of serious injuries also continues to fall, testifying to a structural transformation in safety in public spaces.
.webp?width=200&height=200&name=image(38).webp)
|
"The success of the Finnish capital is the result of a strong political commitment to the systematic implementation of Vision Zero. There is no single measure that will achieve zero deaths on the roads" Henk Swarttouw, President of the European Cyclists' Federation, August 29, 2025, Roadpal
|
Lessons from Helsinki
The Helsinki experience offers two useful lessons for communities aiming for a Vision Zero strategy.
Firstly, Vision Zero can never be achieved without measuring the reality of travel. Accidents only tell the end of the story. Understanding usage (where, when, how) enables us to anticipate risks before they become tragedies.
On the other hand, data becomes effective when it creates a common language. In Helsinki, engineers, town planners, maintenance departments and elected representatives sometimes made decisions in silos. By sharing the same figures, they have aligned priorities, budgets and actions.
This approach is replicable. Any local authority seeking to reduce accidents, gain a better understanding of its traffic flows or justify improvements can draw inspiration from the Finnish method. Today, they can enhance and accelerate their Vision Zero policy thanks to artificial intelligence solutions such as the CITIX-AI Evo system.