.webp)
Facing these challenges, the city has invested in both formal transit (Light Rail Transit) and urban space revitalisation.
Recently, the city adopted a long-term strategic framework, the Utsunomiya City Future Urban Plan (未来都市計画), which promotes a more compact, connected and liveable urban model. Within this vision, walking, proximity and everyday mobility play a central role.
To support this transformation, the city has relied on a simple but robust foundation: long-term pedestrian and cyclist counting data.
Challenge
Before pedestrian and cycling data was systematically used as a planning reference, Utsunomiya faced a common difficulty identified in its Future Urban Plan. They want adapt urban policies to real, evolving patterns of use rather than assumptions.
The plan explicitly recognises the risks of fragmented decision-making, car dependency, and declining activity in certain parts of the city centre. Yet translating these strategic ambitions into concrete, prioritised actions required a better understanding of how public spaces were actually used, day after day and year after year.
Without continuous observation, it was difficult to distinguish between temporary variations, linked to weather, events or seasonal cycles, and deeper structural trends related to demographic change, commercial activity or mobility shifts. This gap limited the city’s ability to evaluate policies over time and to align different departments around a shared diagnosis.
.webp?width=700&height=432&name=image(41).webp) Bicycle parking near Utsunomiya train station - CelloSong, CC BY-SA 4.0 via Wikimedia Commons
Bicycle parking near Utsunomiya train station - CelloSong, CC BY-SA 4.0 via Wikimedia Commons
Solutions
To address this challenge, Utsunomiya developed a permanent pedestrian and cyclist counting network in its city centre, fully aligned with the Future Urban Plan’s emphasis on observation, evaluation and adaptive governance.
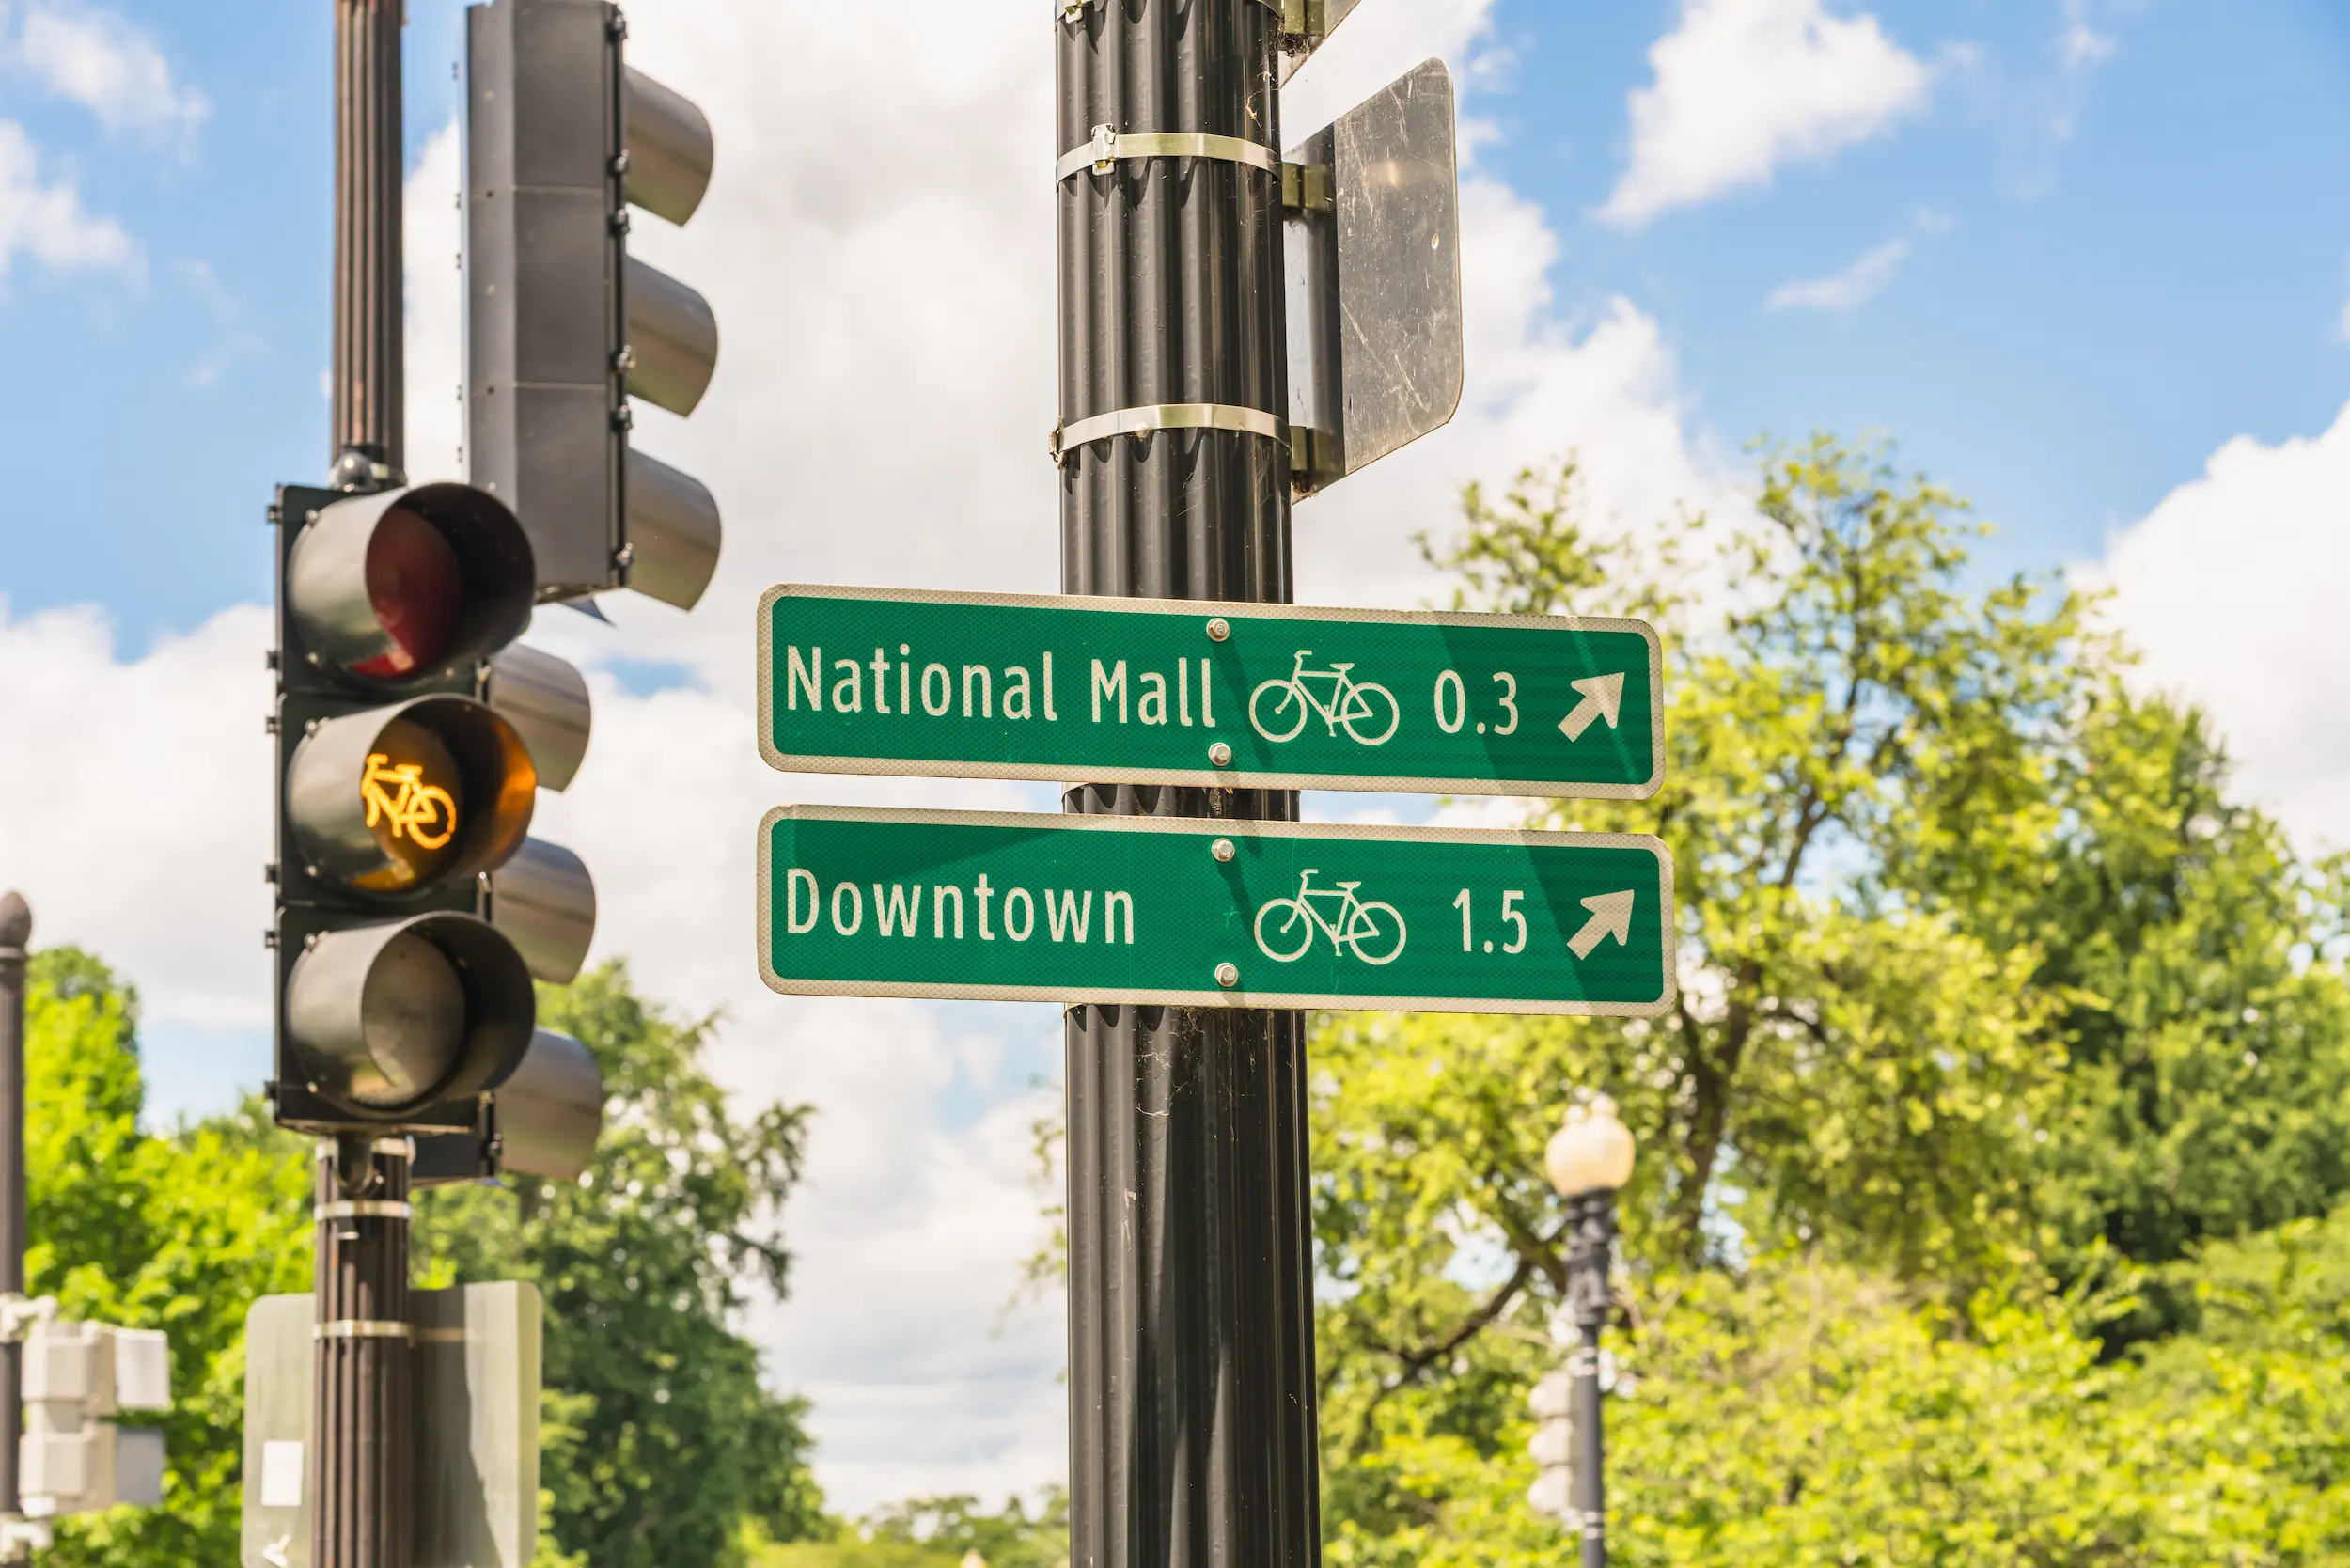
Since 2016, 16 infrared pedestrian and cyclists counters (14 Pyro Box and 2 Zelt) have been installed at key locations such as the pedestrian passages around JR Utsunomiya Station, the Orion Street shopping arcade, and major central intersections. These sensors collect pedestrian counts continuously, 24 hours a day, throughout the year.
This approach produces longitudinal datasets that make it possible to analyse pedestrian and cyclists activity by hour, day of the week, season and year. The data are published through the city’s open data portal, reinforcing transparency and enabling reuse across services and by external stakeholders.
Rather than pursuing complex predictive models, the city prioritised continuity, comparability and clarity, in line with the Future Urban Plan’s call for measurable, trackable urban policies.
Outcomes
What the data revealed ?
Over time, the pedestrian counting data made visible the everyday rhythms of Utsunomiya’s city centre.
.webp?width=690&height=374&name=image(42).webp) Traffic volume around JR Utsunomiya Station (up to October 31st)
Traffic volume around JR Utsunomiya Station (up to October 31st)
The data highlighted recurring daily patterns, with clear differences between weekday and weekend use, reflecting commuting, shopping and leisure behaviours. It also revealed spatial contrasts between streets and districts, showing that not all parts of the city centre evolve in the same way.
These long-term observations helped distinguish predictable seasonal fluctuations from more structural changes, a distinction explicitly identified in the Future Urban Plan as necessary for evaluating urban revitalisation policies and mobility strategies.
Rather than producing isolated figures, the data provided a shared, continuous picture of urban life, supporting evidence-based discussions about the city’s evolution.
How the data supported the city’s strategy ?
These long-term measurements provided a shared, objective reference that could be used across departments.
Pedestrian and cycling data helped urban teams prioritise interventions in areas with sustained or increasing levels of use, while also challenging assumptions in locations where activity was gradually declining. Operational services were able to better align maintenance, lighting and cleaning schedules with observed patterns of use, rather than relying solely on fixed timetables. This approach also supported Utsunomiya’s broader ambition to promote a cyclist-friendly community, by ensuring that everyday management of public space reflected actual mobility practices.
More broadly, the availability of continuous pedestrian and cyclists data made it possible to observe how wider mobility changes, including the introduction of the Light Rail Transit system, interacted with walking activity in the city centre over time. While the data did not dictate decisions, it provided a factual basis for more informed dialogue, evaluation and adjustment of urban policies.
.webp?width=700&height=466&name=image(43).webp) By MaedaAkihiko - Own work, CC BY-SA 4.0
By MaedaAkihiko - Own work, CC BY-SA 4.0
Learnings
Utsunomiya’s experience highlights the value of long-term measurement in urban governance.
First, continuity matters. Even simple counting data becomes powerful when collected consistently over many years, allowing cities to move beyond snapshots and to understand trends with confidence.
Second, clarity is essential. Readable indicators such as hourly or daily pedestrian counts can serve as a common language between technical teams, planners and elected officials, facilitating shared understanding and more coherent decision-making.
Rather than aiming for sophisticated analytics from the outset, Utsunomiya demonstrates the effectiveness of measuring first, understanding patterns second, and using data as a stable foundation for discussion and action.
.webp?width=700&height=551&name=image(44).webp) Illustration of the hierarchical public transport network that the city aims to develop
Illustration of the hierarchical public transport network that the city aims to develop
Conclusion
By investing in a long-term pedestrian counting network, Utsunomiya has chosen to make everyday mobility visible in a simple and durable way. The objective was not to control movement, but to better understand how people use public space over time.
In a context of urban transformation and evolving mobility systems, this approach shows how continuous data can support more grounded, transparent and collective decision-making. It is a reminder that, for many cities, the most valuable data is not the most complex, but the most consistent.