Analysis of bicycle traffic in Europe – Q1 2022

Published Apr 14, 2022
Urban areas
Events & company news

To find out, we’ve gone back to our analysis of bicycle ridership since the beginning of the health crisis, to give the trends for the last three years. The analysis is done by comparing the 2022 bicycle ridership with the 2019 baseline year (pre-pandemic), analyzing weekday and weekend bicycle ridership separately. The data are analyzed using a representative sample of bicycle counters located in Europe.

In order to obtain a more exhaustive vision, we have separated the analyses, observing on the one hand the urban sites and the daily cycling practice, and on the other hand the cycle tourism practice on different European EuroVelo cycle tourism routes.


Report on the first quarter of 2022 – daily cycling
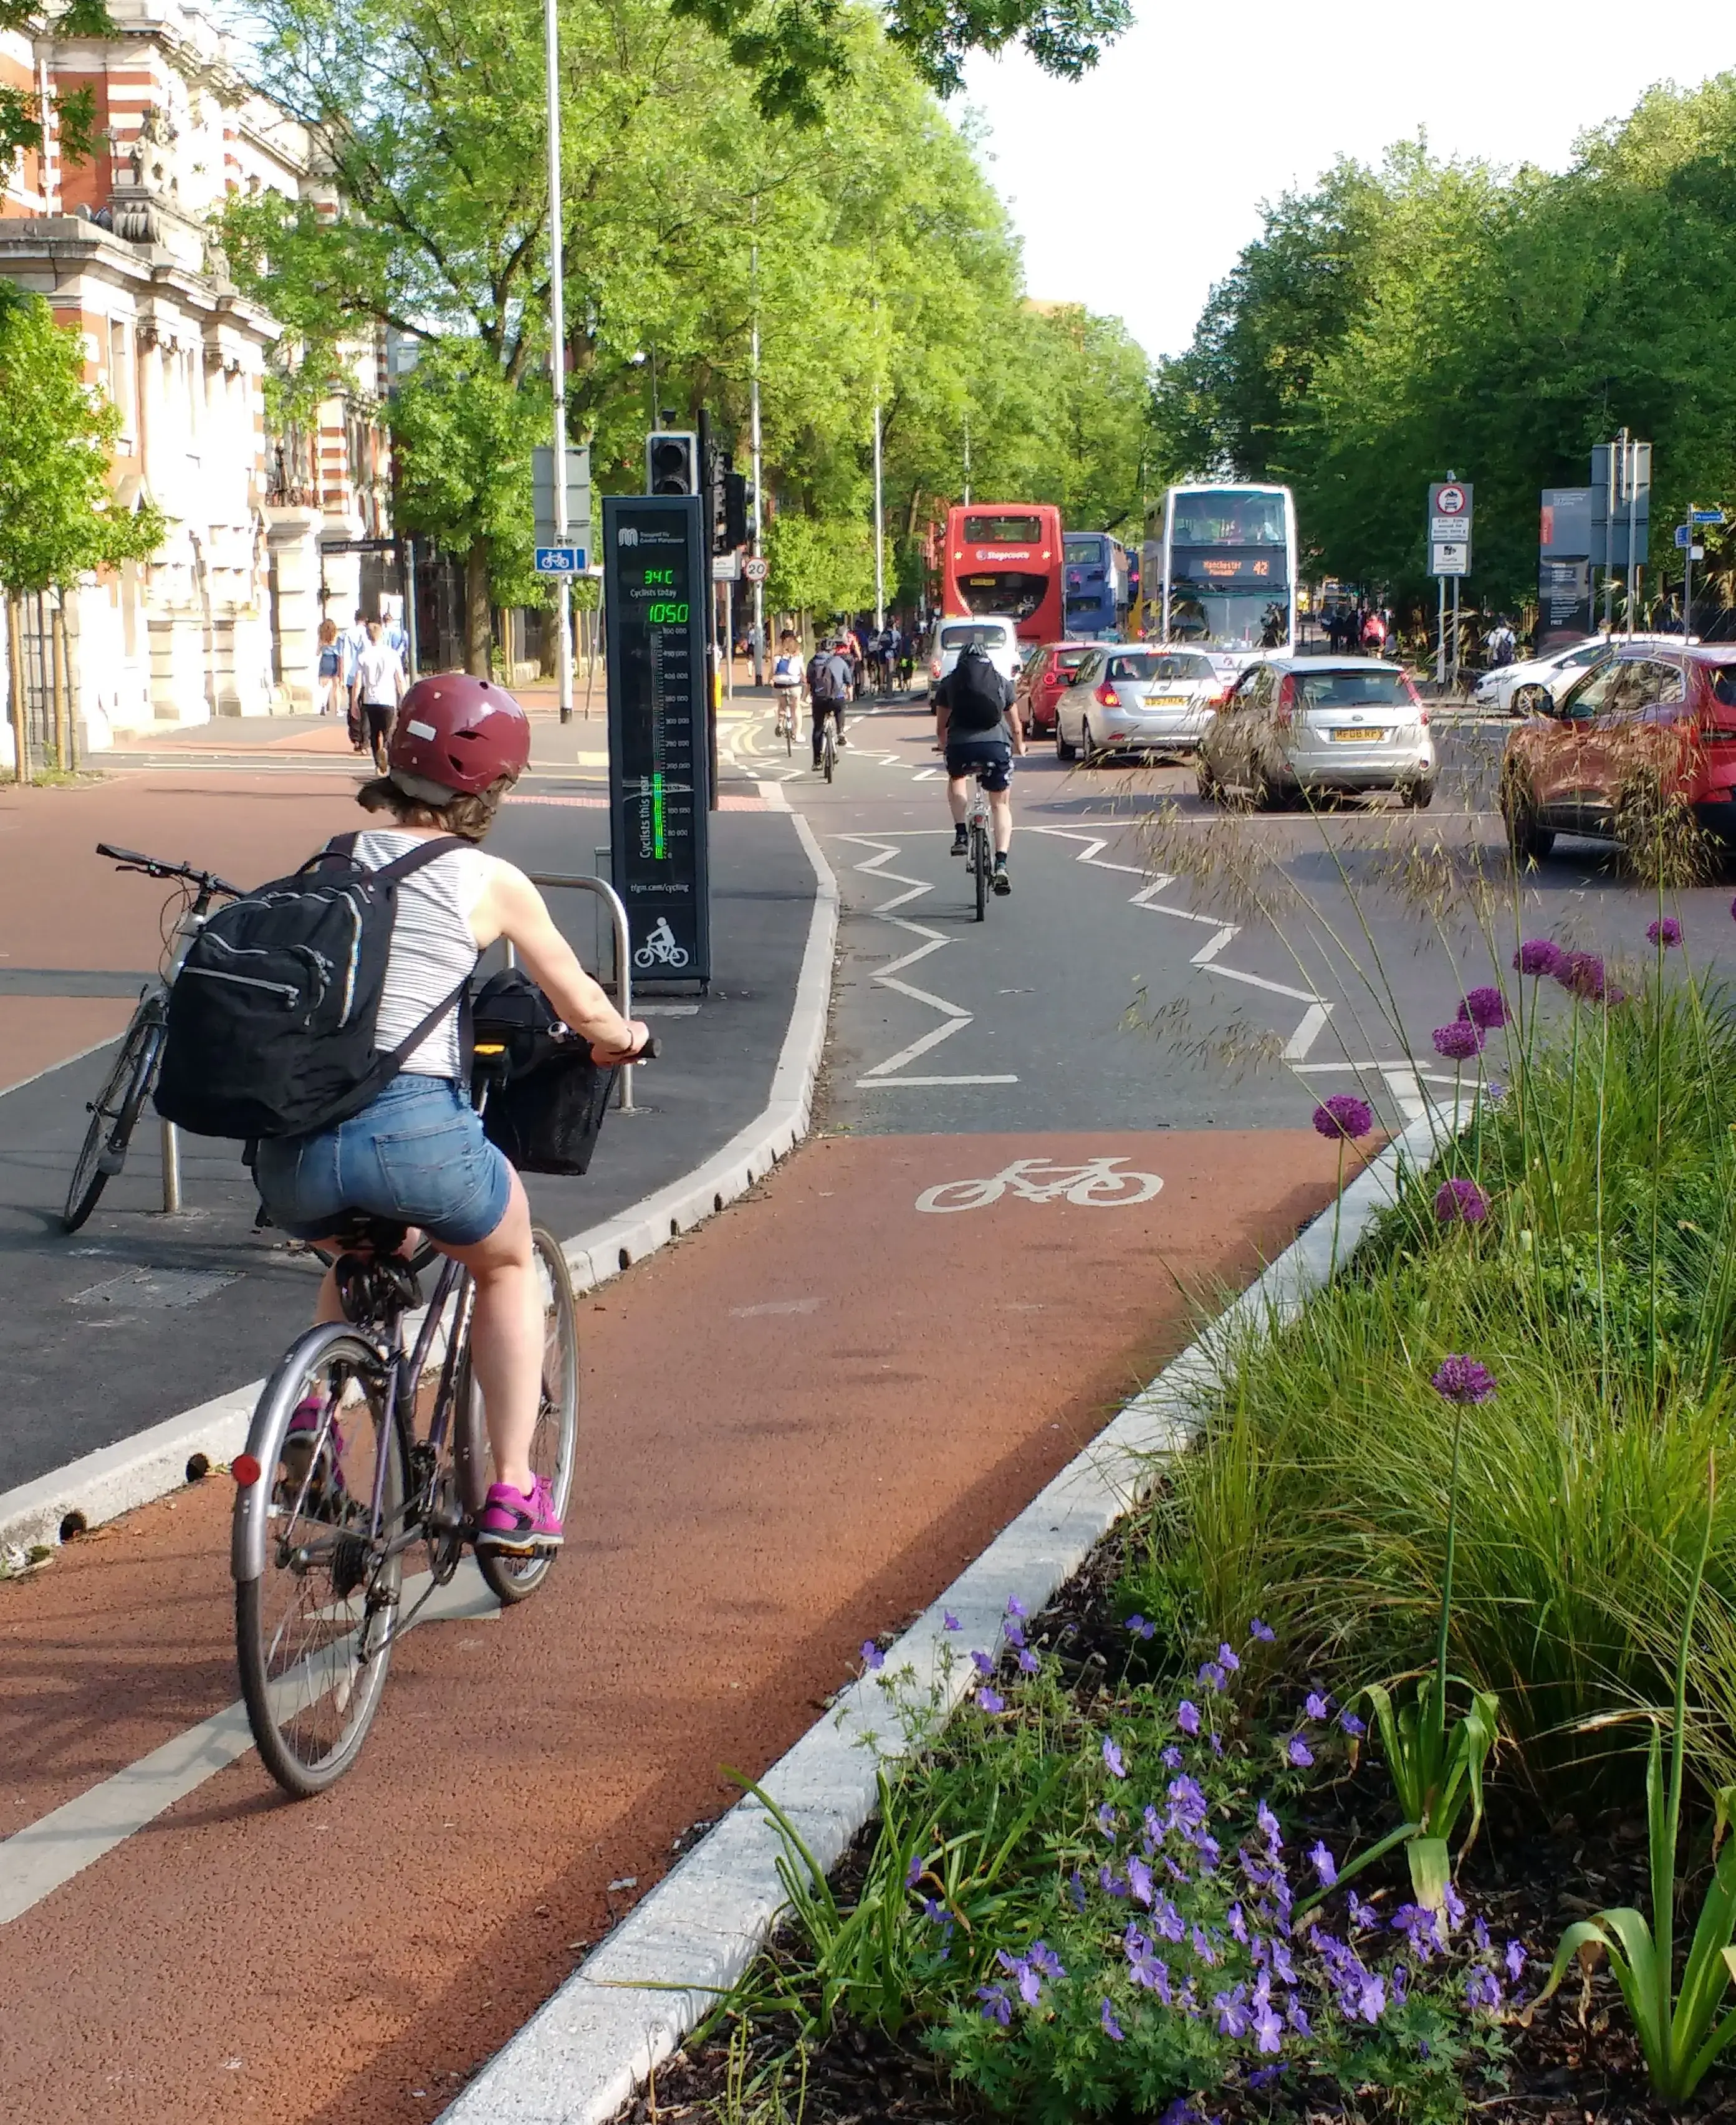
Cycling on weekdays

While the year 2021 was rather stable compared to 2019 for weekdays, the first quarter of 2022 stands out clearly with an increase in cycling (compared to the first quarter of 2019) in 9 out of 12 countries studied. The countries with the largest increase in bicycle traffic are Poland, Italy and France.

Weekday bike counts by European country in Q1 2022 (vs. 2019)

Cycling on weekends

On the other hand, weekend cycling has increased significantly in 2020 and 2021 (most likely driven by leisure cycling as a decompression activity). This increase is clearly not about to slow down: weekend day cycling is still increasing in all countries surveyed, compared to 2019. Growth rates are particularly impressive in England with +64% increase between 2019 and 2022.

Weekend bike counts by European country in Q1 2022 (vs. 2019)


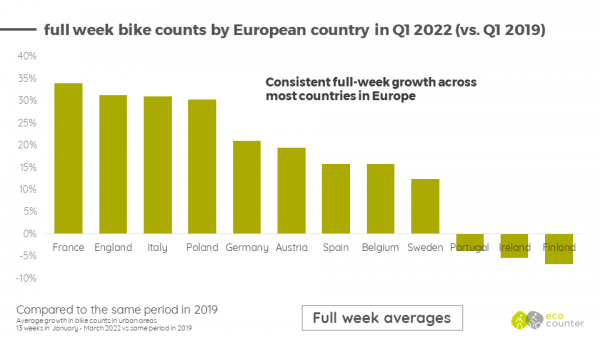
Global bicycle ridership

When analyzing the whole week for all countries, the overall picture of bicycle use remains very positive. In 9 countries surveyed for a total of 12, cycling in the first quarter of 2022 is up from 2022. And the increase is not small: from +34% in France to +12% in Sweden.

Fullweek bike counts by European country in Q1 2022 (vs. 2019)


The average increase in Europe is +16%.


Some perspective on growth rates: average counts per site per country (2021)

It is clear that a growth rate of 50% does not mean the same thing if the traffic is 100 passages or 1,000 passages. For this reason, we have calculated the average counts per counting site per country, to give some perspective. Here are the results as a reminder:


NB: the average traffic observed over the first quarter is not yet representative of the whole year. We can see that traffic in the first three months of the year represents between 8% of total traffic (for Sweden) and 18% (for Italy). The update of these data for the second half of the year will provide more information on bicycle use in 2022, compared to previous years.

Want to know more?

Explore our dashboard here

Subscribe to our blog

Product suggestion

The CITIX-AI Evo lets you count a wide range of modes in areas with mixed traffic

CITIX-AI Evo

Artificial intelligence traffic monitoring solution for dense and multi-modal environments.

Ce produit sera supprimé de votre liste d’intérêts. Souhaitez-vous continuer ?
Annuler Enlever de ma liste
Fait ! Cette solution est à présent dans votre liste d’intérêts
Retour Voir ma liste
PYRO_BOX_EVO_people-counter

PYRO-Box Evo

Our most versatile people counter yet. Count in any environment with this battery-powered and discreet counter.

Ce produit sera supprimé de votre liste d’intérêts. Souhaitez-vous continuer ?
Annuler Enlever de ma liste
Fait ! Cette solution est à présent dans votre liste d’intérêts
Retour Voir ma liste
MULTI Evo is the ideal solution for counting and classifying users in natural environments.

MULTI Evo Nature

A pedestrian, cyclist, and scooter counter designed for the outdoor environment.

Ce produit sera supprimé de votre liste d’intérêts. Souhaitez-vous continuer ?
Annuler Enlever de ma liste
Fait ! Cette solution est à présent dans votre liste d’intérêts
Retour Voir ma liste

More to read:

Visitor data supports business development in the city center of Jyväskylä
Published on May 9, 2025

Visitor data supports business development in the city center of Jyväskylä

A Guide to Summer Counting: Part 3 - Use Your Data like a Pro
Published on May 1, 2025

A Guide to Summer Counting: Part 3 - Use Your Data like a Pro

A Guide to Summer Counting: Part 2 - Set up a System
Published on May 1, 2025

A Guide to Summer Counting: Part 2 - Set up a System