.webp?width=205&height=50&name=LOGO_EN_LARGE%20(1).webp)
|
|
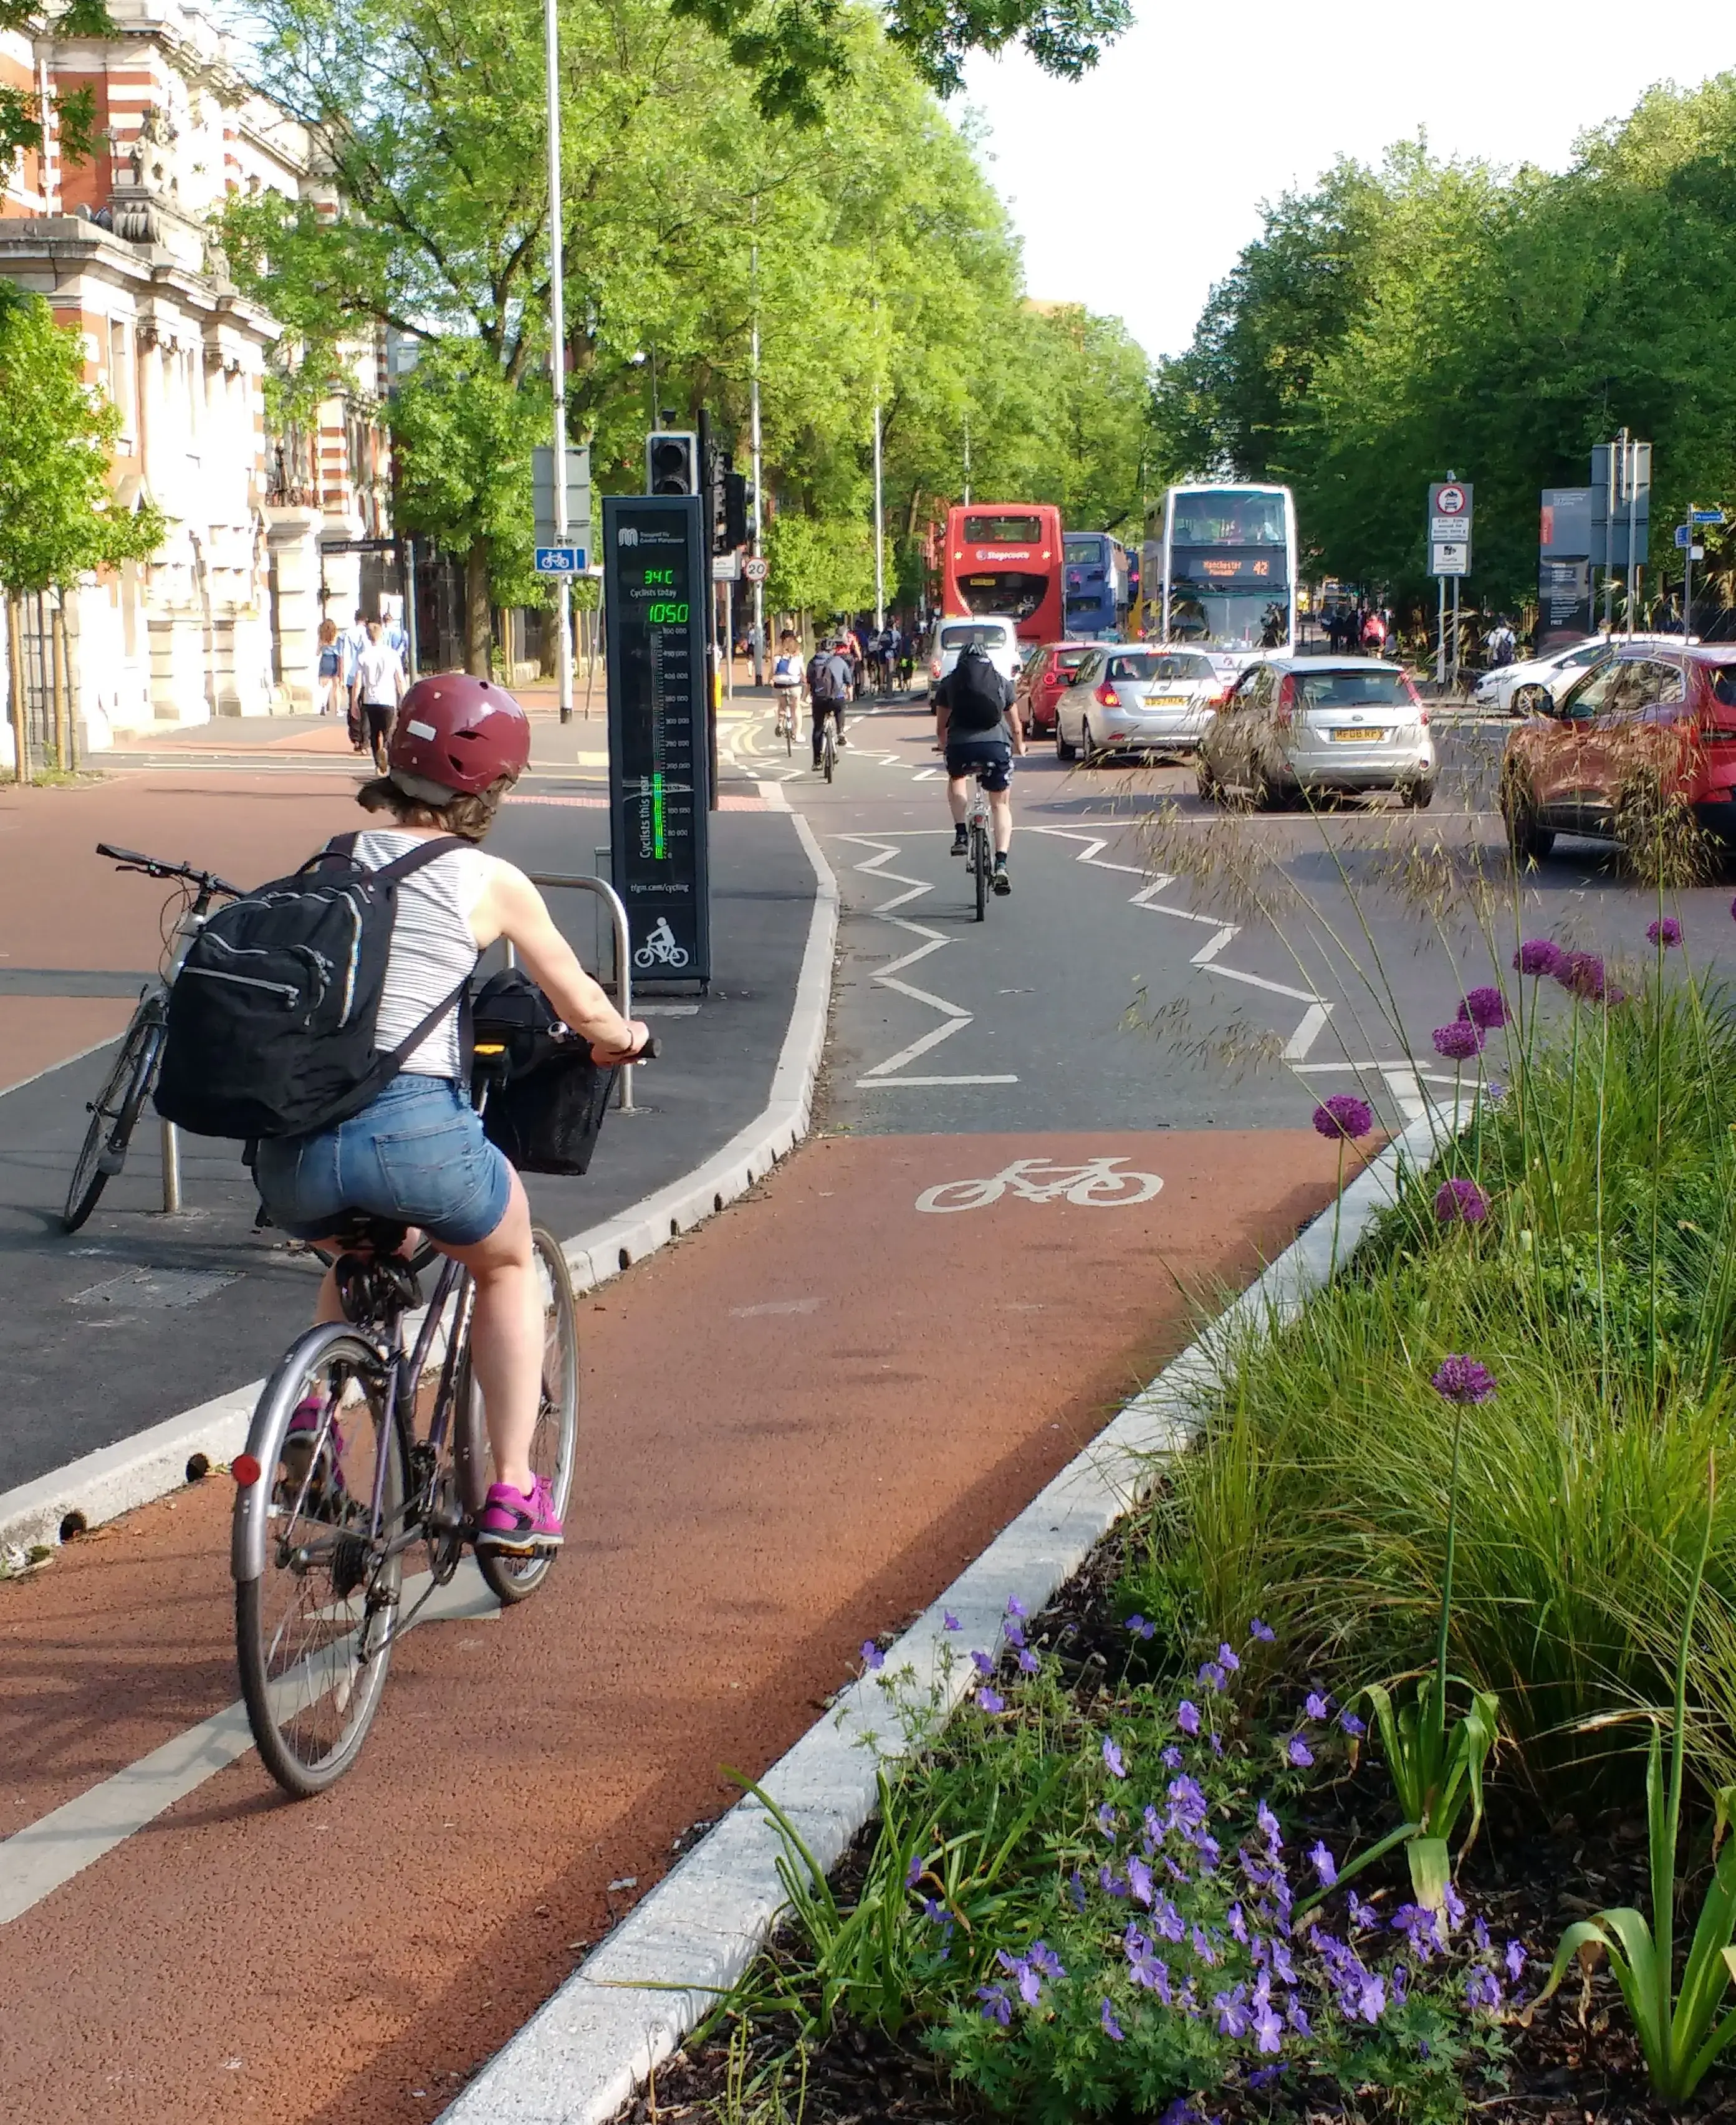
Since 2014, many key routes into Manchester city centre have been upgraded to include dedicated (often bus‑segregated) cycle lanes, including the high-profile Oxford Road project.
The Oxford Road corridor in Manchester is one of Europe’s busiest bus routes, with over 100 buses using it every hour. It also has high footfall and is a strategic cycling link for the city — all competing for limited street space.
To make cycling safer, give buses priority, and reduce conflict between buses, cyclists, and pedestrians, an ambitious redesign project started in 2014. |

%20Bee%20Network_TfGM_lock%20up_rgb.png?width=1825&height=424&name=(FOR%20SCREEN)%20Bee%20Network_TfGM_lock%20up_rgb.png) Active travel challenges
Active travel challenges
To measure the effects of “one of the most ambitious highway projects Manchester city centre has seen” (from Transport for Greater Manchester officials words), stakeholders needed a clear, credible way to:
- track behaviour change over time,
- prioritise space for buses, cycling, and walking,
- communicate outcomes consistently to decision-makers, operations teams, and the public.
In a nutshell: a simple, continuous picture of who uses the corridor, when, and how — robust enough for both operational use and public-facing reporting on active travel evolutions.
Solutions implemented
To achieve this, the local authorities used a mix of permanent automated counters, temporary manual and automated studies, enforcement and monitoring of traffic flows, plus surveys and safety/behaviour evaluations to track outcomes.
- Permanent cycle counters with a display (our very own Eco-DISPLAY) were installed in the protected cycleway to measure and share daily and cumulative cycle flows with the public.
- Automated vehicle counts and bus‑priority monitoring (including camera enforcement at bus gates) tracked bus volumes, journey times and illegal motor traffic.
- Short-term before-and-after surveys and temporary counts (manual counts, CCTV or temporary sensors) were used to compare cycle and pedestrian volumes, modal shift and peak-period changes.
- Bus journey-time and reliability measures were collected to assess whether priority measures reduced delays.
- Safety and user‑experience evaluations (collision/casualty statistics, accessibility audits, and stakeholder feedback from disabled groups and local communities) informed qualitative and quantitative assessments.
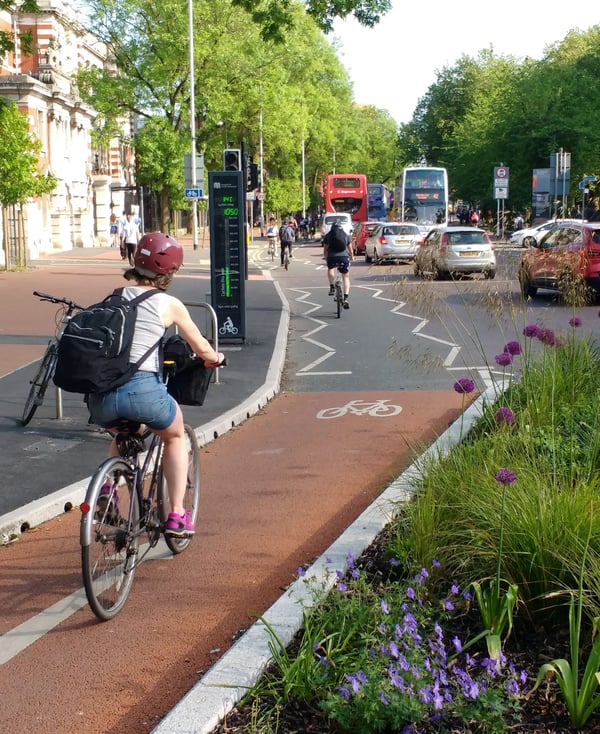
“The Eco-Display is very popular with the cycling community and the public in general in Manchester. It is a visible indication of TfGM’s commitment to supporting sustainable travel, and has allowed TfGM to promote the success of the Oxford Road cycling infrastructure scheme.” Martin Mildenhall, Intelligent Transport Systems Engineering Manager at TfGM.
Outcomes
What the bicycle count data revealed
After the project was completed in 2017, an initial analysis was carried out to measure the impact of the scheme (published on GOV.UK). The official report notes:
Total southbound flow in the 11-week period in autumn 2017, one year after installation of the counters, was 38% higher than in the same period in autumn 2016. Counts analysed for March 2018 show there had been continued increase in cycle volumes in the section 2 to 2.5 miles from the city centre. Relative to the March 2015 baseline, the March 2018 count shows increases in cycle volumes 0-2 miles from the city centre of between 85% and 176% and increases in cycle volumes 2-2.5 miles from the city centre of between 104% and 128%. In the calendar year 2018 more than 1 million journeys were counted on the route on Oxford Road, with up to 5,000 people passing each day. This equates to 621,000 car journeys, and reduces up to 1.9 tonnes of nitrogen dioxide or 873.5 tonnes of carbon dioxide.
But it didn’t stop there. In the longer term, data from the counter and display show that cycle traffic kept on breaking records, year after year.
Overall, between 2018 and 2025, cycle traffic increased by 33%, from 2,888 average daily trips to 3,846.
(1).webp?width=700&height=480&name=chart(58)(1).webp)
Public reporting indicates ~7,000 cyclists/day in October 2025, up from ~2,000/day before the segregated cycleway.
Globally, Greater Manchester recorded 700M+ active travel trips in 2025, reinforcing the value of measurement and public reporting for walking and cycling growth.
Learnings & conclusion from this active travel project monitoring
As we can see in this success story, the metrics & public-facing display helped to:
- ground decisions in consistent trends (not only perceptions),
- support communication with a simple, trusted, repeatable indicator,
- connect corridor performance to a wider network story (Bee Network), making change legible and scalable.
Permanent counting helps guide decisions and supports regular communication before, during and after a project, so progress can be tracked. It keeps providing evidence of behaviour change long after the redesign has been completed.
Interested by our solutions? Get in touch!