Since the beginning of the pandemic, we have been analyzing bicycle traffic trends in 14 countries around the world 4 times a year, to give an overview of trends. What should we remember from this month’s update for the first half of 2022?
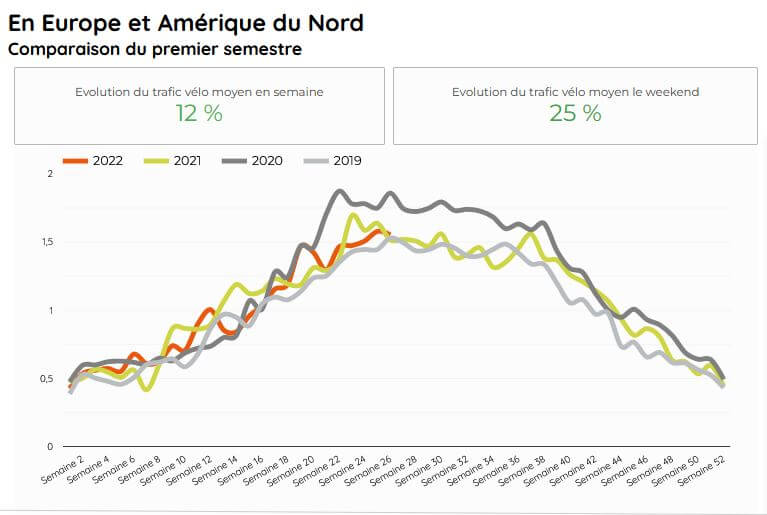
1. The new normal of 2022 includes much more cycling than 2019
Across all countries analyzed, the figures show cycling is up by +12% on weekdays, +25% on weekends compared to the first half of 2019.

For comparison, the analysis made on the first three months (January, February and March 2022) showed an increase of 17% on weekdays, and 37% on weekends. So we have a growth in practice that is slowing down slightly, but still very positive.
2. Strong growth in bicycle traffic between 2019 and 2022 for the majority of countries analyzed
Of the 14 countries studied, Italy has the highest growth in traffic, followed by France and Austria. As noted in the first key trend, the overall progression of bicycle traffic is impressive, with half the panel recording a growth of over 25%!

3. A sustained cycling boom in some countries, but not all
For some countries analyzed in the panel, 2022 bicycle traffic is higher than pre-pandemic levels, while some are merely returning to the situation of 2019.
In the first category, we find countries like Italy, France or Austria where bicycle activity in 2022 has surpassed all previous years.

In the second category we find countries such as the USA, where 2022 bicycle traffic trend is following 2021 and 2019 so far.
Bicycle traffic in USA (First semester of 2022 vs. previous years)

4. A growth of traffic driven by recreational and commuting cycling
When analyzing bicycle traffic trends by typology of days, we can see that, unlike what was observed during some periods of time of the pandemic, both weekday and week-end cycling is on the rise in 2022 compared to 2019 (with the exception of Canada, Finland and Ireland, where weekday traffic is down by 7-15%). It means that this evolution of bicycle traffic is driven both by recreational and commuting cycling in many countries.