.webp?width=205&height=50&name=LOGO_EN_LARGE%20(1).webp)
In short: Eco-Visio now automatically adds school breaks and holidays, using consistent names tailored to your location, to save time and ensure more reliable comparisons.
Available starting today, and rolling out gradually through the end of the year to all our customers with the Expert plan, Eco-Visio now integrates these events directly into the tool — without manual configuration — and makes them available for use in your analyses and comparisons.
Consistent names for year-over-year comparisons, tailored to the location of your counters
And each period retains its name —Christmas break, All Saints’ Day, Ascension Day, National Day— even when the dates vary from year to year or from region to region. Comparing two holidays, two summers, or two non-holiday periods is finally simple!
Event suggestions are automatically adjusted based on the counters’ locations to match the actual context of the observed area.
What this feature brings to your daily work
- Operational time savings: no more manual re-entry every year.
- More reliable season-by-season comparisons: consistent benchmarks help distinguish underlying trends from calendar effects.
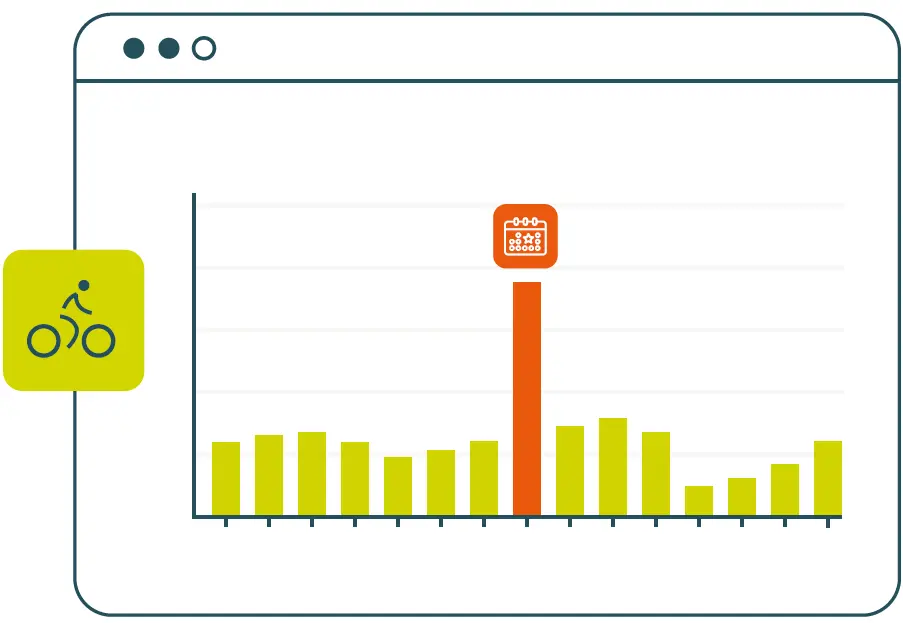
- Immediate insight into peaks and drops in traffic: a peak on a Thursday in May can be explained at a glance (whether it’s a holiday or not, or a vacation period or not).
- Comparisons excluding vacations and holidays: Exclude these periods to measure “normal” behavior, uninfluenced by key dates (May 1, etc.).
How to use it?
A few examples:
For a tourist site manager, a quick overview of the May long weekends and public holidays makes it easy to compare the impact of the May long weekends on visitor numbers this year versus last year and to explain any declines by calendar differences (such as a holiday falling on a Sunday rather than a Saturday). Visualizing the different school calendars across various regions can also help measure the impact of tourist visitation by geographic area.
For someone responsible for promoting active transportation in their region, identifying school break periods helps distinguish between a structural decline in traffic and a simple “school breaks + holidays” effect on bicycle counts.
Where can you find this in the tool?
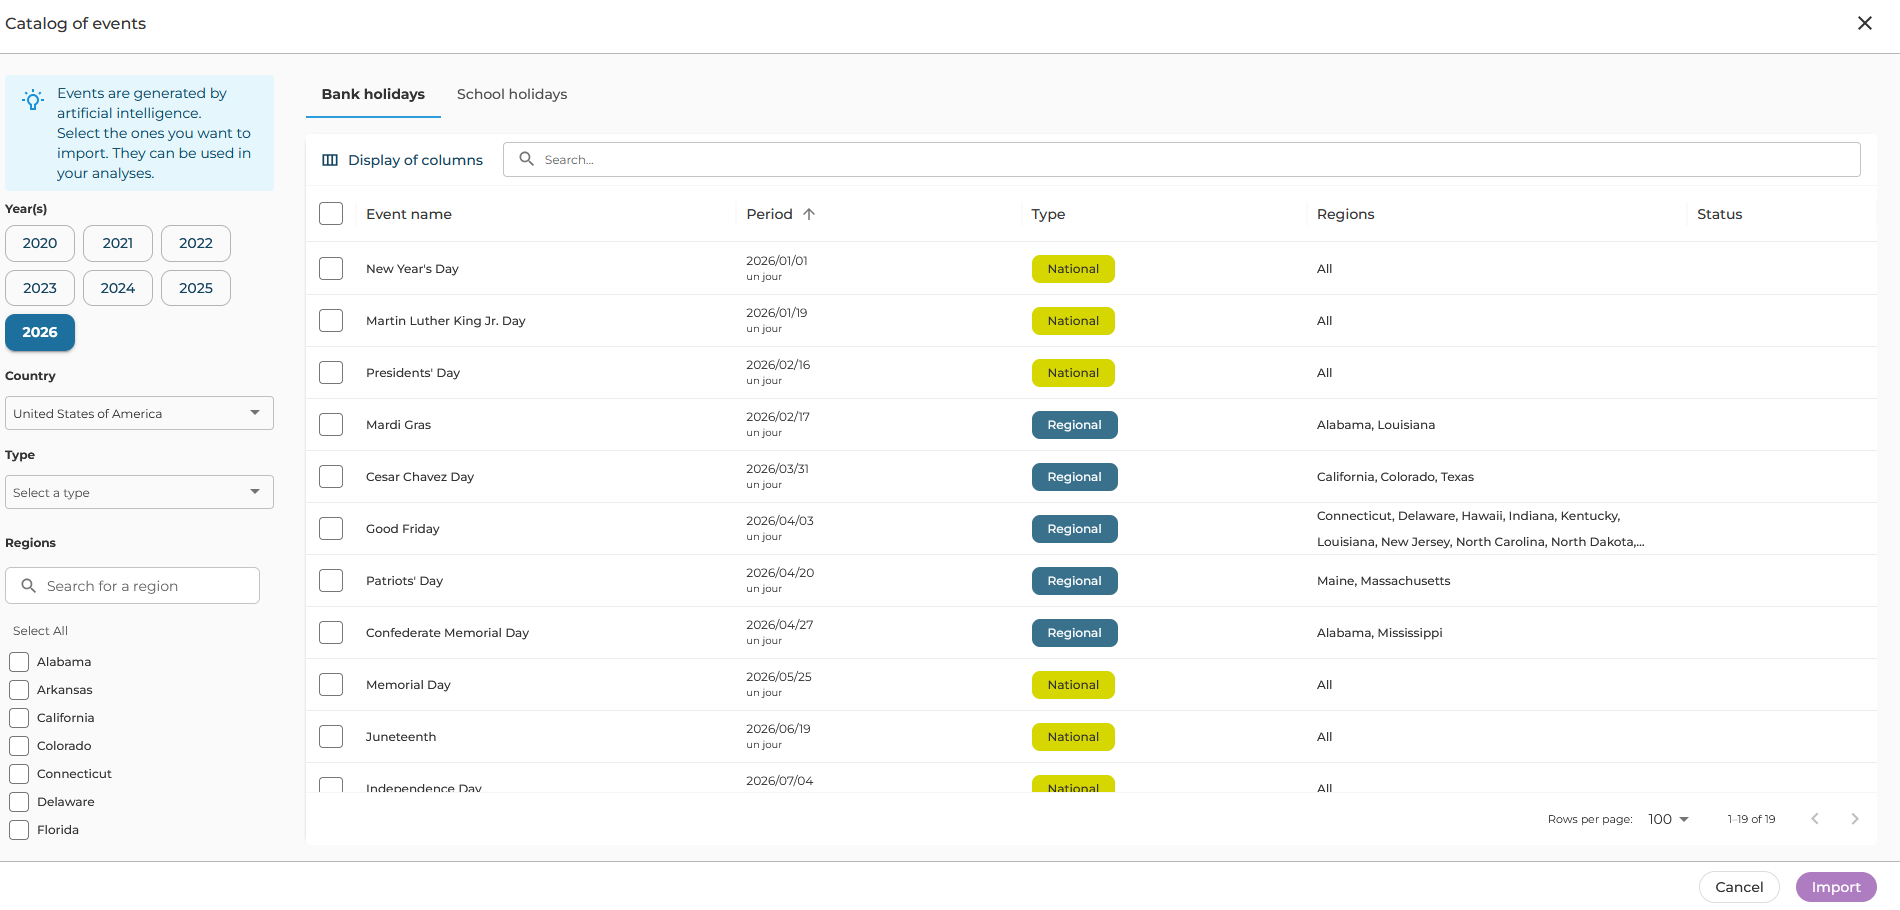
- Directly from the main menu > Sites > Events
- Simply click on the top banner to start the import, and then check the boxes to automatically import the selected events after a quick review (and any necessary modifications)
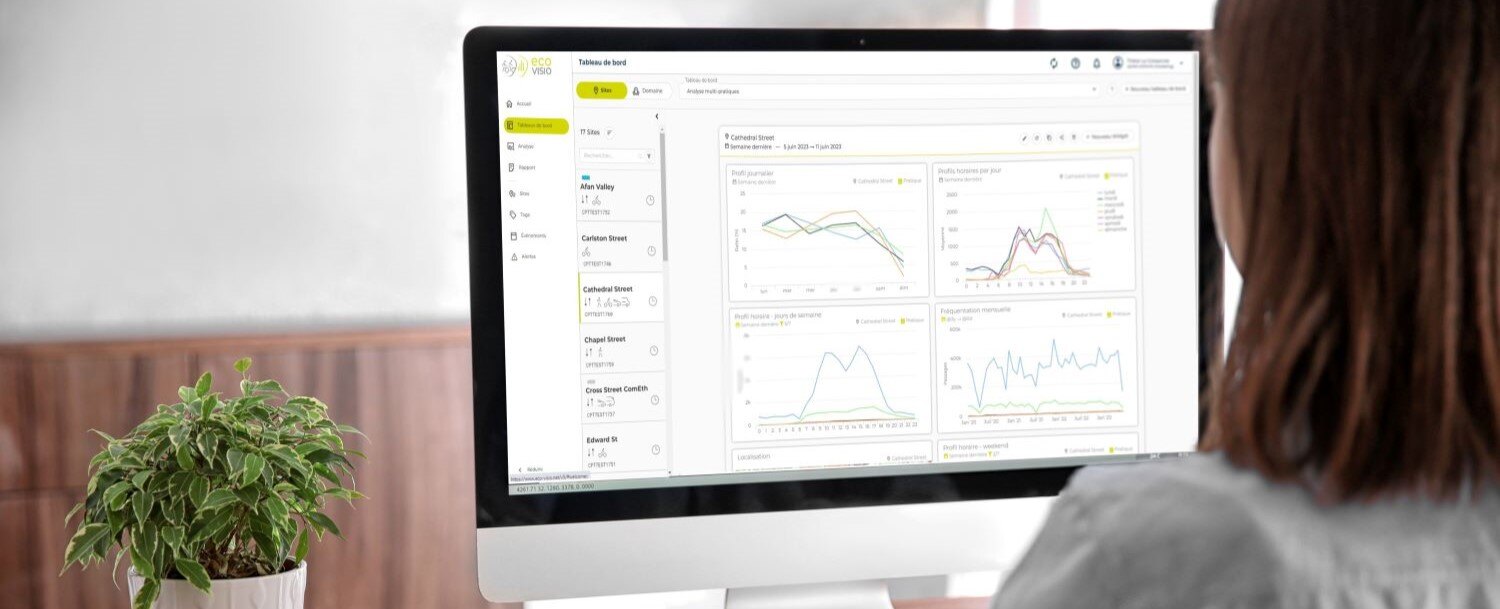
- All set! The events are then available on the analysis screens, overlaid on the counts for quick and easy interpretation.
Availability
The catalog will be rolled out gradually in all countries by the end of the year.
If you’re interested in a demo of this feature, contact us!