Summary
There is not a single “best” bike counter technology: the right choice depends on environment, counting duration, and what you need to measure (cyclists only vs mixed modes, low/high traffic data, direction/speed, classification).
- To get long-term trends (highest robustness): Induction loops (Eco-Counter: ZELT Evo) — excellent reliability on clearly defined bike lanes / paths.
- To do a short-term study (fast deployment): Pneumatic tubes (Eco-Counter: TUBES) — quick install for short campaigns and before/after studies (bike-only focus).
- To count on shared paths: Infrared multi-sensor (Eco-Counter: MULTI Evo) — counts and differentiates users on greenways, parks, trails. Perfect for bicycle and pedestrian planning.
- To understand bike flows (direction + speed): Radar / AI radar (Eco-Counter: WAVIX-AI) — supports flow, direction, speed insights with non-intrusive installation.
- To monitor cyclists in complex urban areas (intersections / multimodal): AI vision-based solution (Eco-Counter: CITIX-AI Evo) — offers classification when complexity is high.
- To analyze network-level patterns: Floating data - origin-destination matrixes, route choices — should be validated with ground-truth counts for better accuracy.
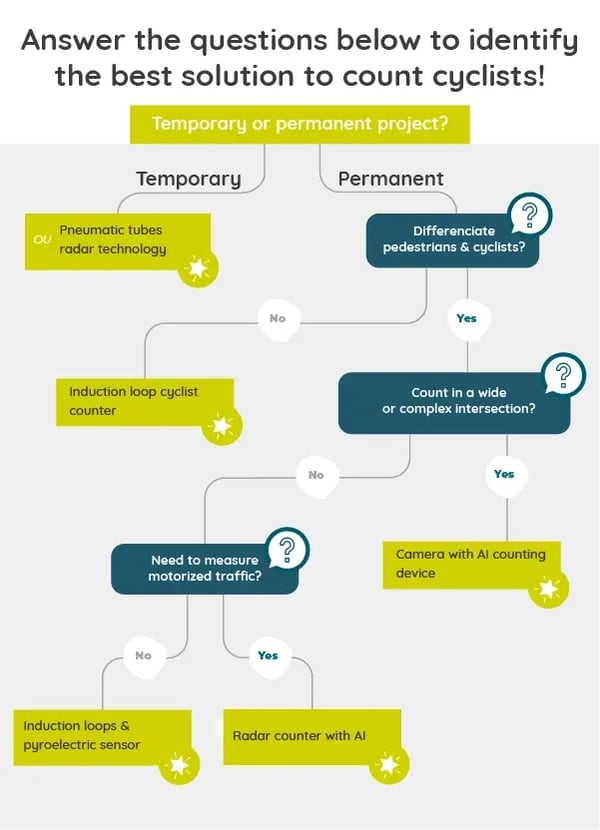
Guidance: define which bike counter you need
Cyclist counting technologies comparison
| Technology | Best for | Key strengths | Typical constraints | Eco-Counter solution | Multi-user counting |
|---|---|---|---|---|---|
| Induction loops | Permanent counts on dedicated bike facilities | Reliable, long-term stability, widely adopted worldwide | Civil works required; best on clearly defined lanes/paths | ZELT Evo | Yes (bicycle / e-scooter) |
| Pneumatic tubes | Temporary campaigns, before/after studies | Fast install, mobile, low infrastructure requirements | Short-term; mainly bike-only counting; can be affected by vandalism/vehicle interaction depending on context | TUBES | No |
| Infrared multi-sensor | Shared paths (pedestrians + cyclists) | Differentiation of users, non-intrusive, good for parks and promenades | Local context matters (width, side-by-side groups, mounting) | MULTI Evo | Yes (bicycle / pedestrian) |
| Radar / AI radar | Flows on shared corridors (direction/speed) | Non-intrusive, supports flow understanding, direction and speed, easy calibration and installation | Context-specific performance | WAVIX-AI | Yes (bicycle / pedestrian / vehicles) |
| AI video | Complex urban scenes, intersections, multimodal classification | High richness (classes, turning movements), suited to complexity | Camera placement, sometimes higher cost | CITIX-AI Evo | Yes (bicycle / pedestrian / e-scooters / motorcycles / cars / vans / buses ) |
| Floating data | Network-level patterns (routes, OD, catchment) | Spatial coverage, strategic planning insights | Sample bias; not a direct substitute for ground truth volumes | — | No |

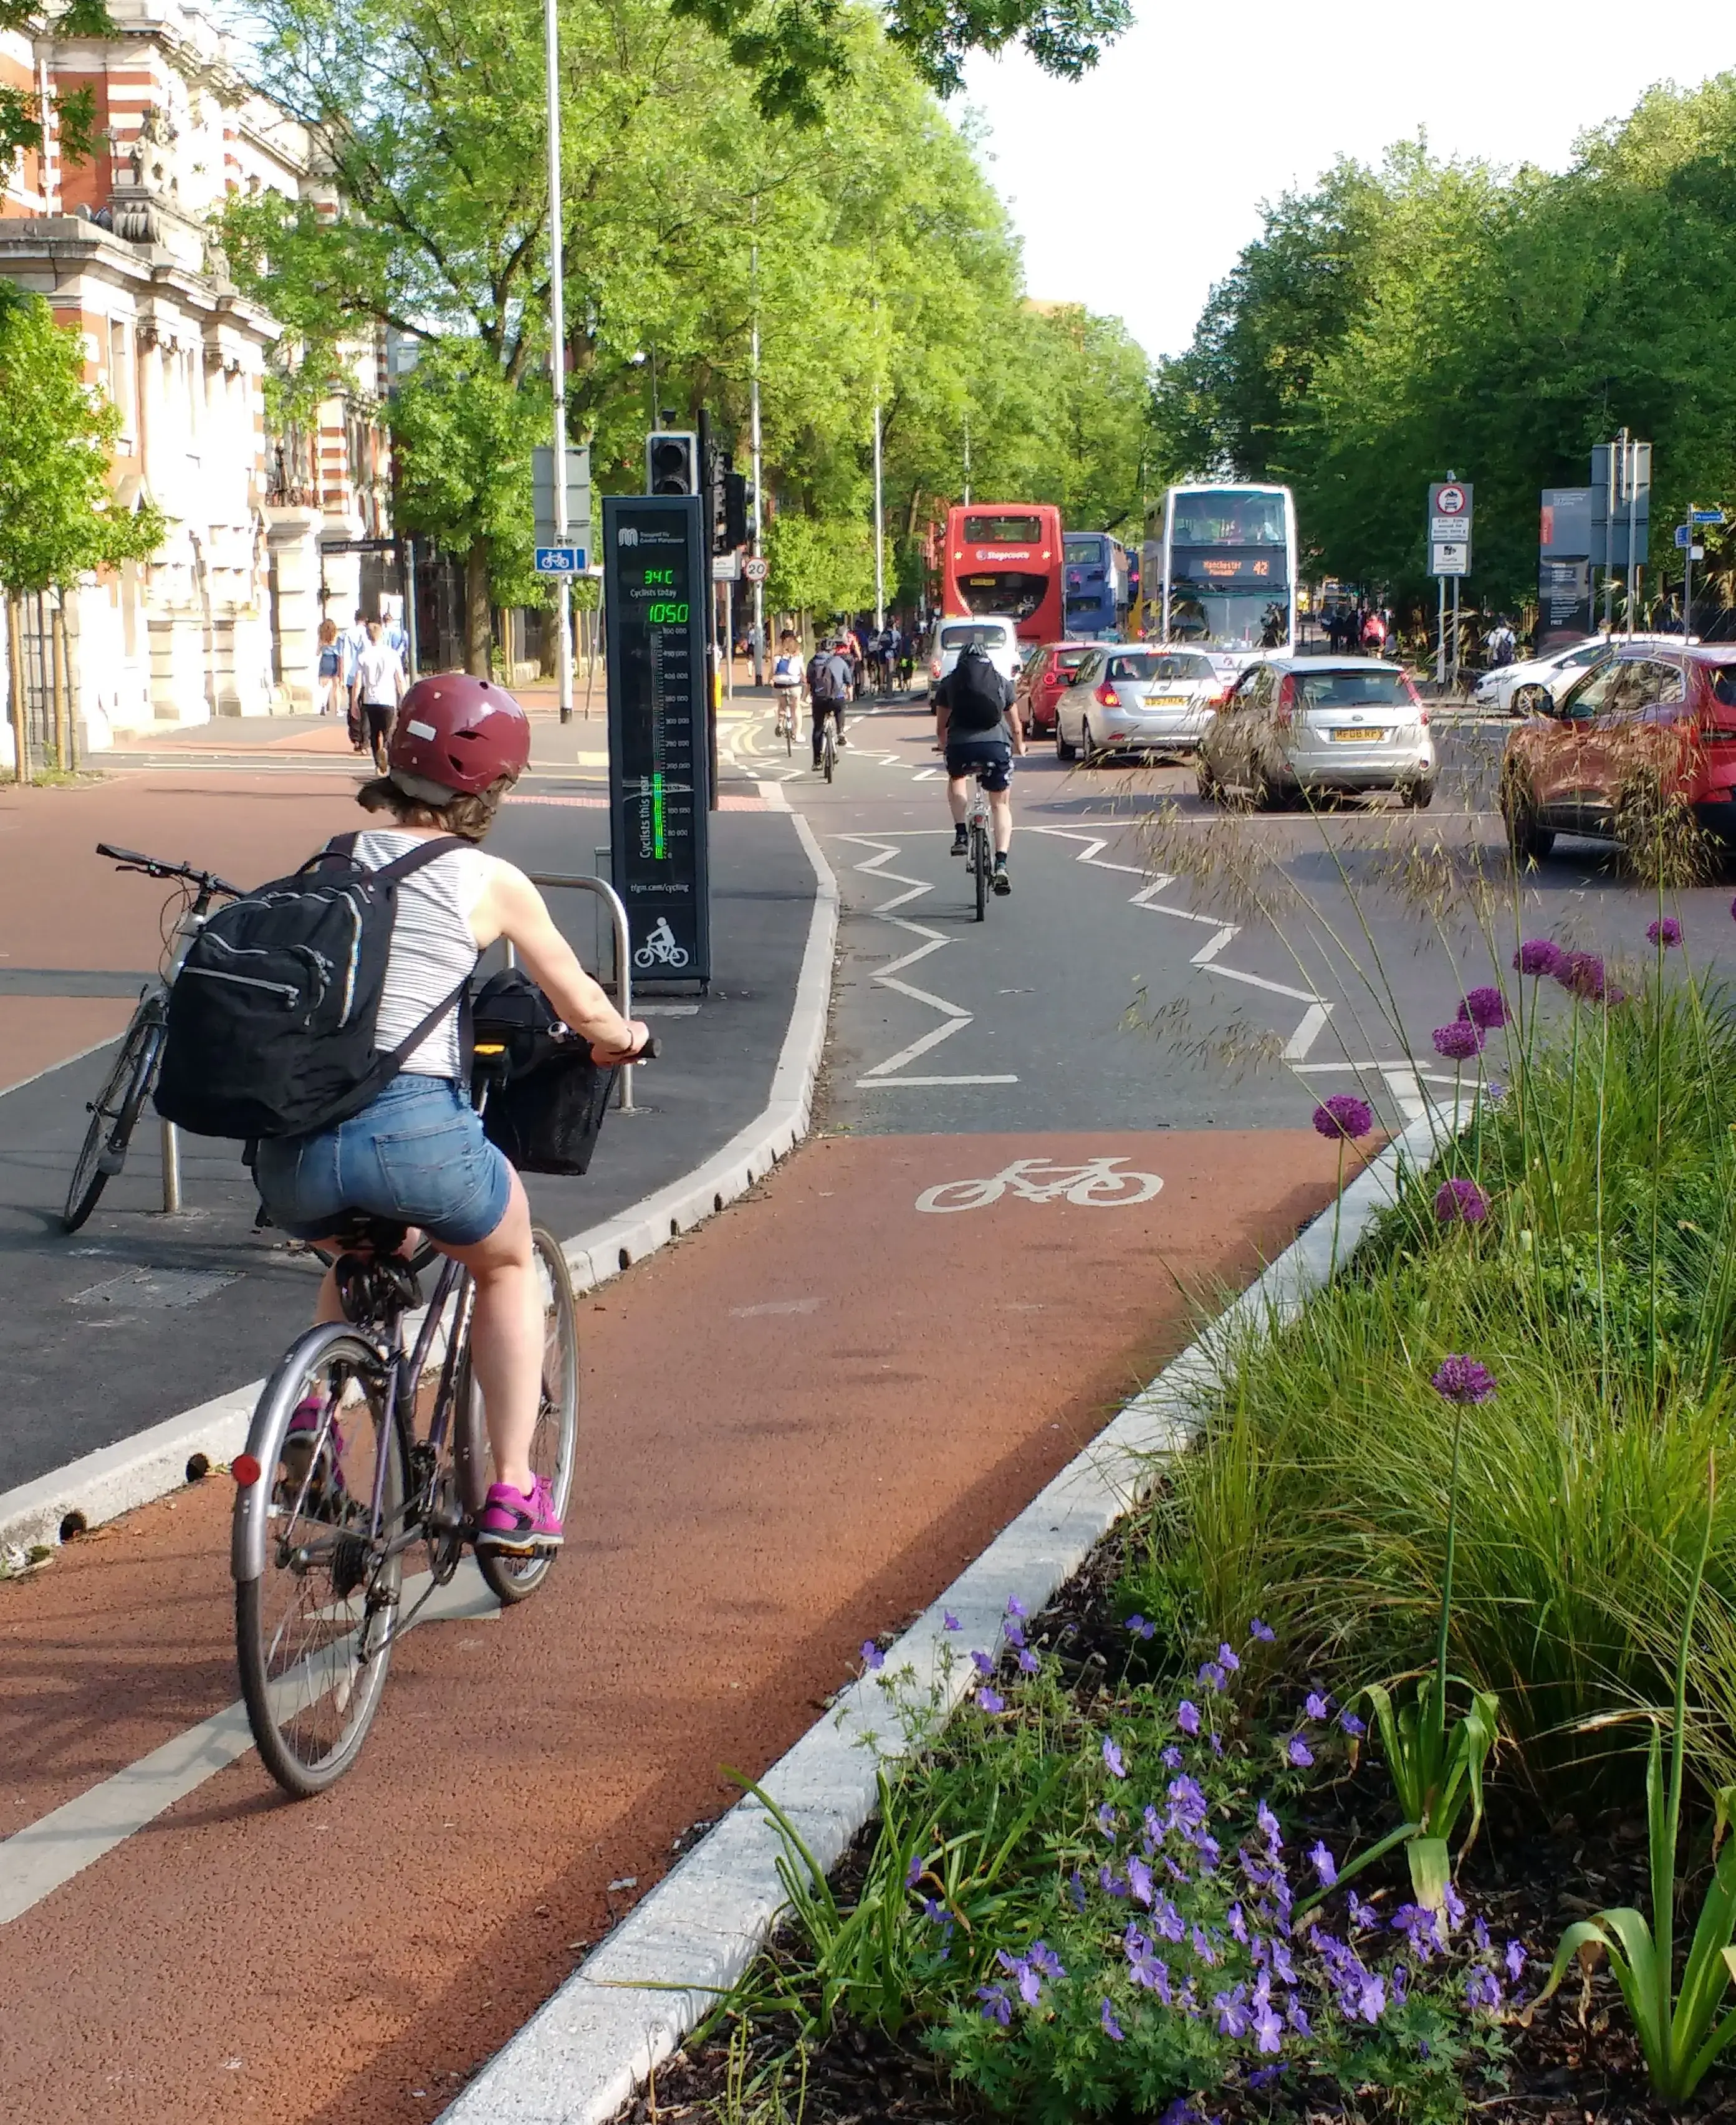
Why collect cyclist traffic data?
Bicycle counts show how cycling volumes change across days, weeks, seasons, and years. This helps local governments and mobility teams plan infrastructure and evaluate policies based on evidence (not intuition). In practice, good counting data delivers reliable indicators to support a sustainable mobility strategy, measure modal share, and inform a city’s bike plan—while helping teams present budgets and justify investments with confidence. Bike counts also support decisions such as where to invest, how to justify budgets, and how to measure the impact of new bike lanes, detours, or safety measures.
In day-to-day terms, this is what mobility and traffic teams need to present the budget, track progress on a bike plan, and build a shared evidence base around modal share and safety—turning raw counts into actionable data analysis and operational dashboards.
What types of bicycle counting technologies are available?
The most widely used technology worldwide: induction loops (Eco-Counter’s bike counter — ZELT Evo)
Induction loops are embedded in the ground and detect bicycles as they pass over the loop. They are particularly reliable for permanent bicycle counting on clearly defined bike paths and bike lanes— ideal when you need a stable baseline for year-over-year reporting, KPI tracking, and budget justification.

Mobile, bike-only temporary counting: pneumatic tubes
Pneumatic tubes are temporarily mounted on the roadway or path. They are useful for short-term surveys, site diagnostics, and before/after comparisons thanks to fast deployment with minimal infrastructure change.
.webp?width=700&height=467&name=TUBES_COM_URB%20(23).webp)
Traffic data for bicycle and pedestrian planning (MULTI Evo)
When pedestrian and bicycle traffic must both be captured (and separated), combined sensor solutions such as MULTI Evo are used. This is common on shared paths, parks, tourist areas, and promenades.

Understanding flows on shared paths: radar (WAVIX-AI)
Radar-based systems help analyze flows, directions, and speeds—useful where multiple user groups interact and where “how people move” matters as much as volumes, especially to detect conflicts of use and improve comfort and safety (i.e., to optimize urban flows on shared corridors).

Understanding complex urban areas: AI camera counting device (CITIX-AI Evo)
At intersections and complex urban sites, AI video systems can classify modes and provide richer insights when simple counting is not enough—useful for traffic management teams looking to optimize urban flows, run richer data analysis, and integrate counting data into existing decision processes.

Floating traffic data — pros & cons
Floating data (apps/GPS/mobile sources) can reveal broader movement patterns and route relationships. It is best used as a complement to stationary counters because it is typically sample-based and must be validated to estimate absolute volumes accurately.
Other indicators to understand cyclist flows
A wide variety of factors can influence bicycle traffic data. Dedicated expert solutions like Eco-Visio’s data analysis platform can help take into account:
- Weather: temperature, rain, wind can strongly influence cycling volumes.
- Events and seasonality: holidays, festivals, school periods.
- Infrastructure changes: new bike lanes, detours, roadworks, traffic calming.
- Safety context: near-miss data, conflict points, intersection design.

This ensures teams can interpret results, understand the data, and turn raw volumes into an operational dashboard (all-in-one reporting when possible).