Published on Jul 15, 2026
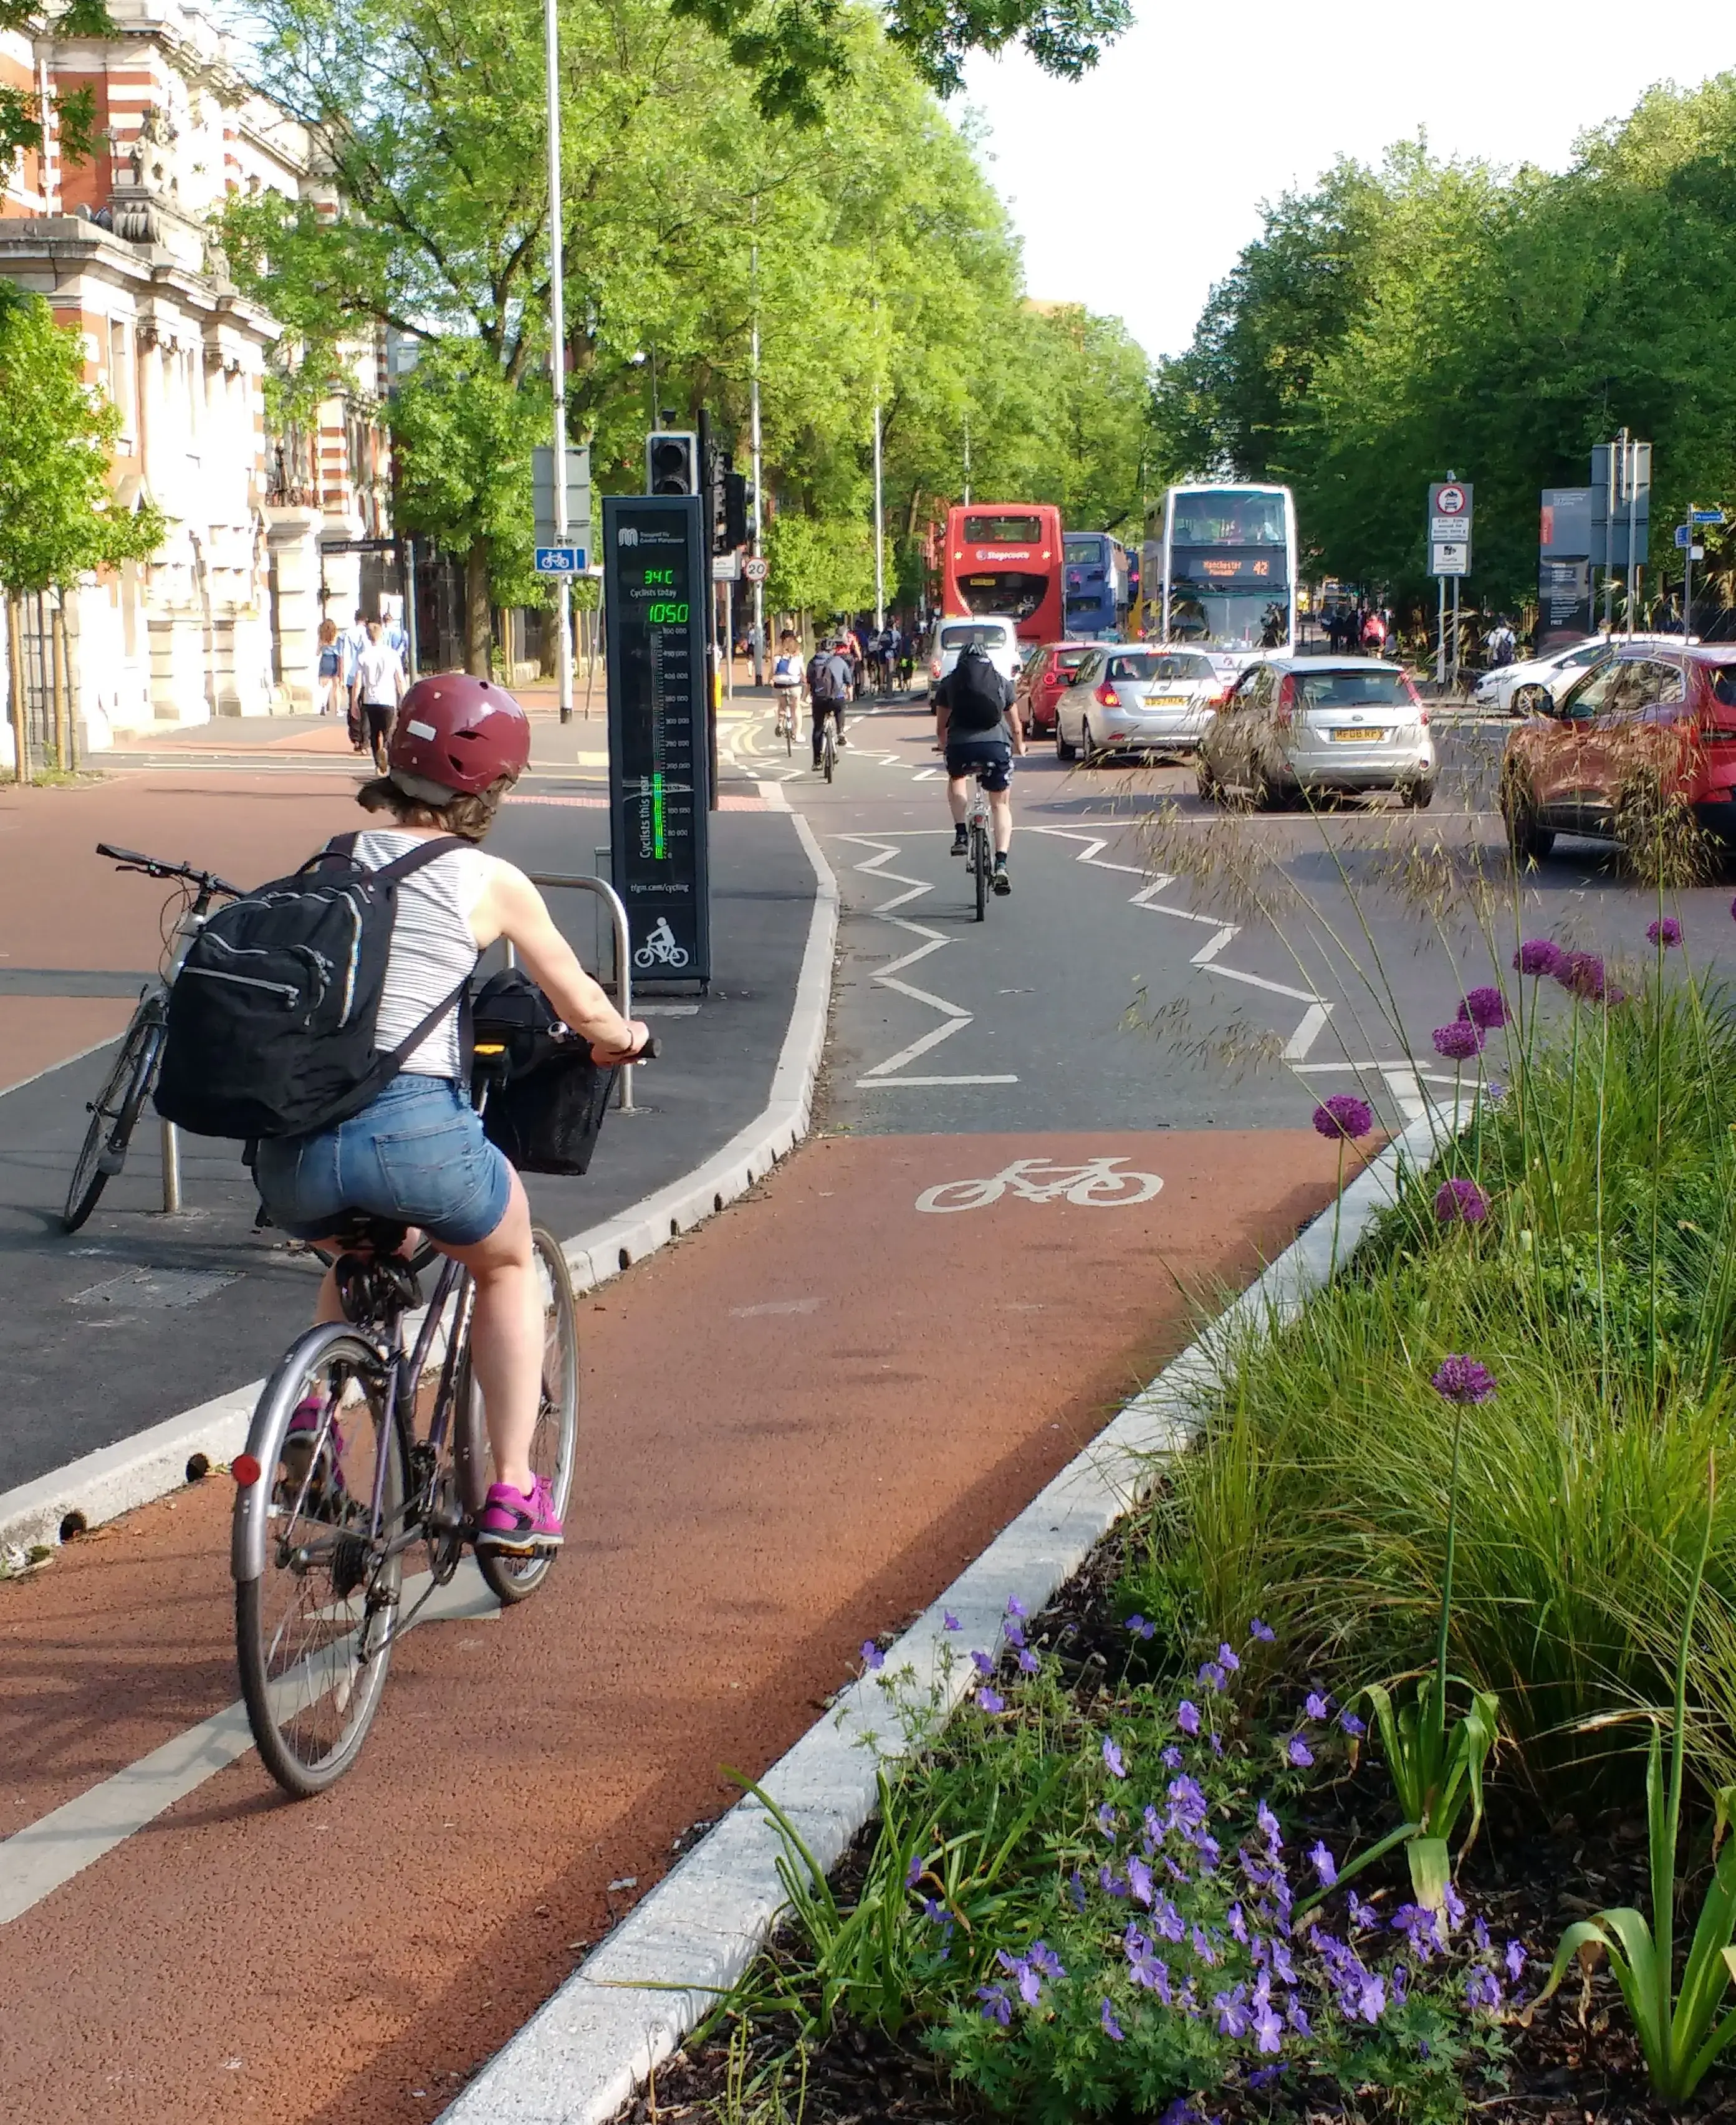
Measure and communicate active travel success with data in Greater Manchester
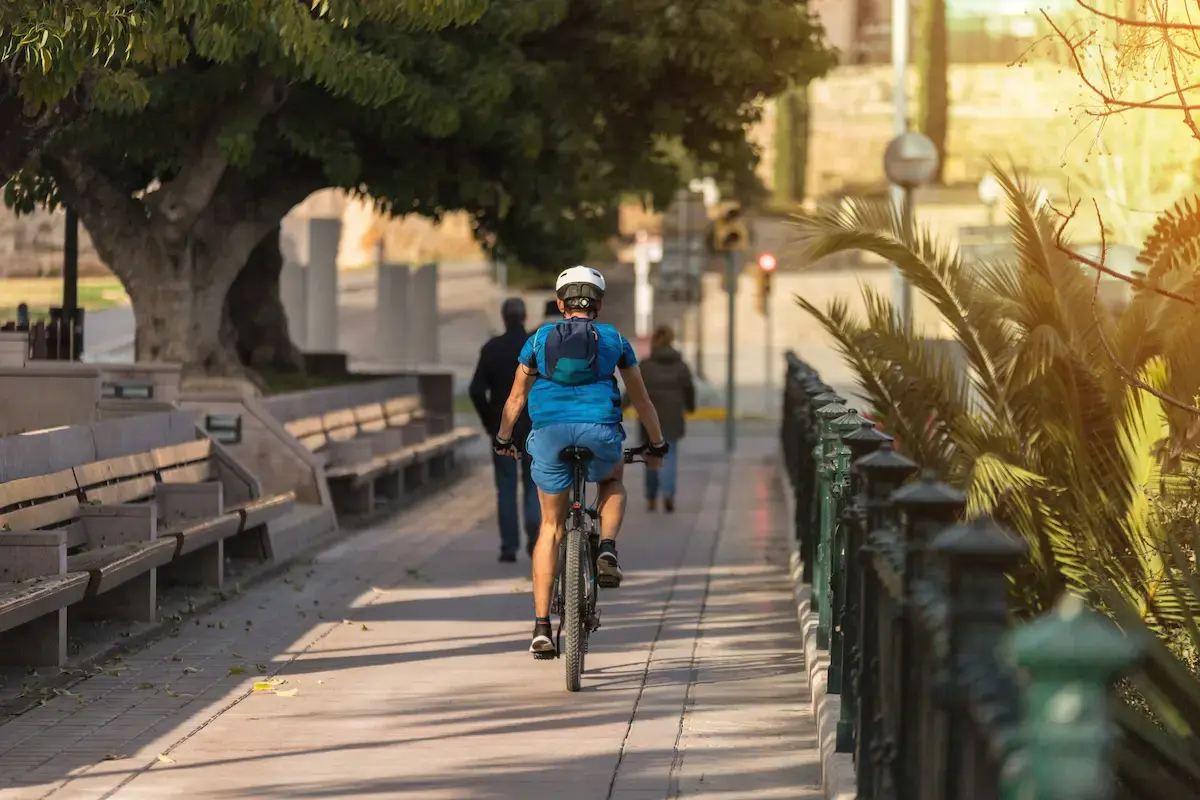
Cycling for transport and leisure is popular across Greater Manchester. It has been boosted by the city-region’s strong cycling culture and by political support for cycling as a mode of transport. ...