.webp?width=205&height=50&name=LOGO_EN_LARGE%20(1).webp)
The reality: counting alone isn’t enough
Many local governments and managers of natural or tourist areas install counters to objectively measure visitor numbers. But a single figure—even a reliable one—doesn’t tell us much if it stands alone. How many bicycles pass through this path each day? The next question almost always follows: so what? What do we do with this information? Is it a lot or not?
Without putting the data into context and analyzing it, managers struggle to demonstrate the impact of a development project, elected officials lack arguments when facing a controversial project, and managers of natural or urban sites have difficulty anticipating peaks in visitor numbers. The data exists, but it only becomes a reliable and useful indicator once it has been interpreted, cross-referenced, and placed in context.
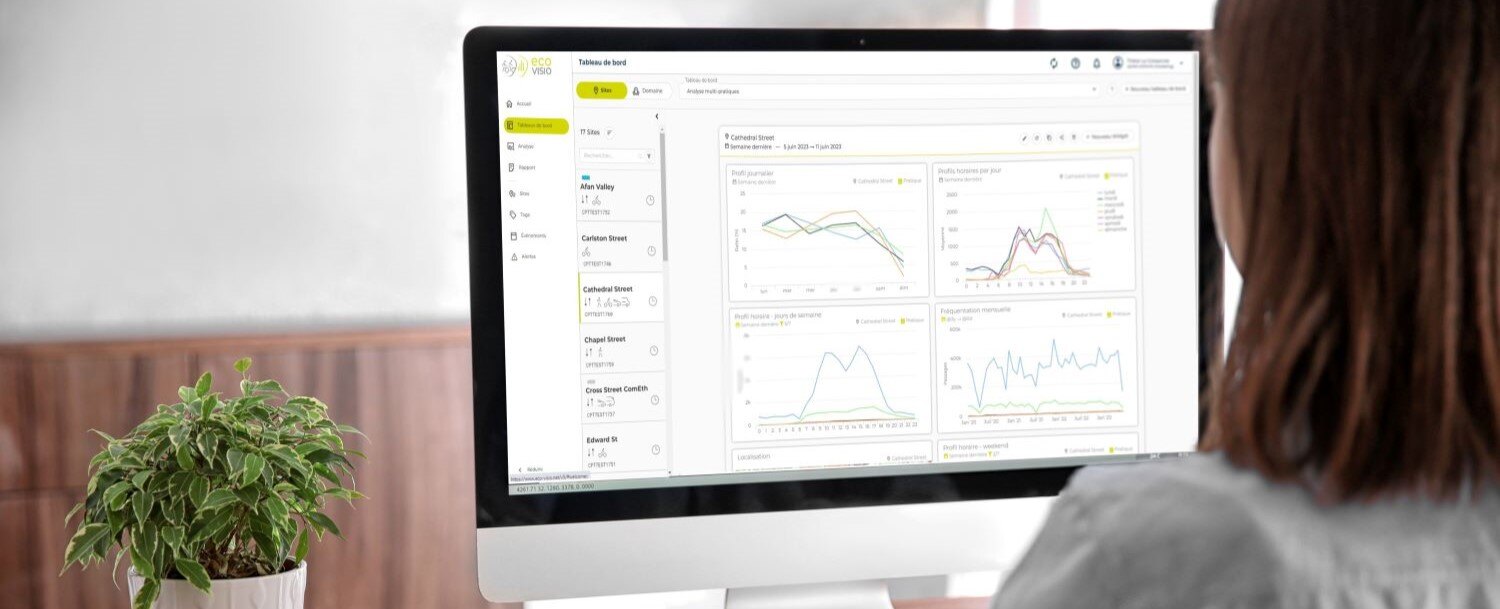
The role of a data analysis platform like Eco-Visio
This is where a data analysis platform like Eco-Visio comes in, designed to aggregate and enrich data from counters:
- Weather data to distinguish between a decline in visitor numbers due to weather conditions and a structural decline
- Geo-dashboards to visualize foot traffic patterns and cross-reference foot traffic with facility layouts (our VisitorFlow solution)
- User profiles and comparative traffic data by user type to provide a coherent view of active and motorized mobility
- Field surveys and qualitative information to provide context for observed trends
- APIs and data-sharing interfaces to make the data usable by other business tools or as open data for citizens
This “expert platform” is what distinguishes a simple reporting of figures from true decision support. Counting data becomes a reliable indicator around which other information is used to build a comprehensive picture.
From data analysis to decision-making: four practical applications
Measuring before-and-after results to demonstrate impact
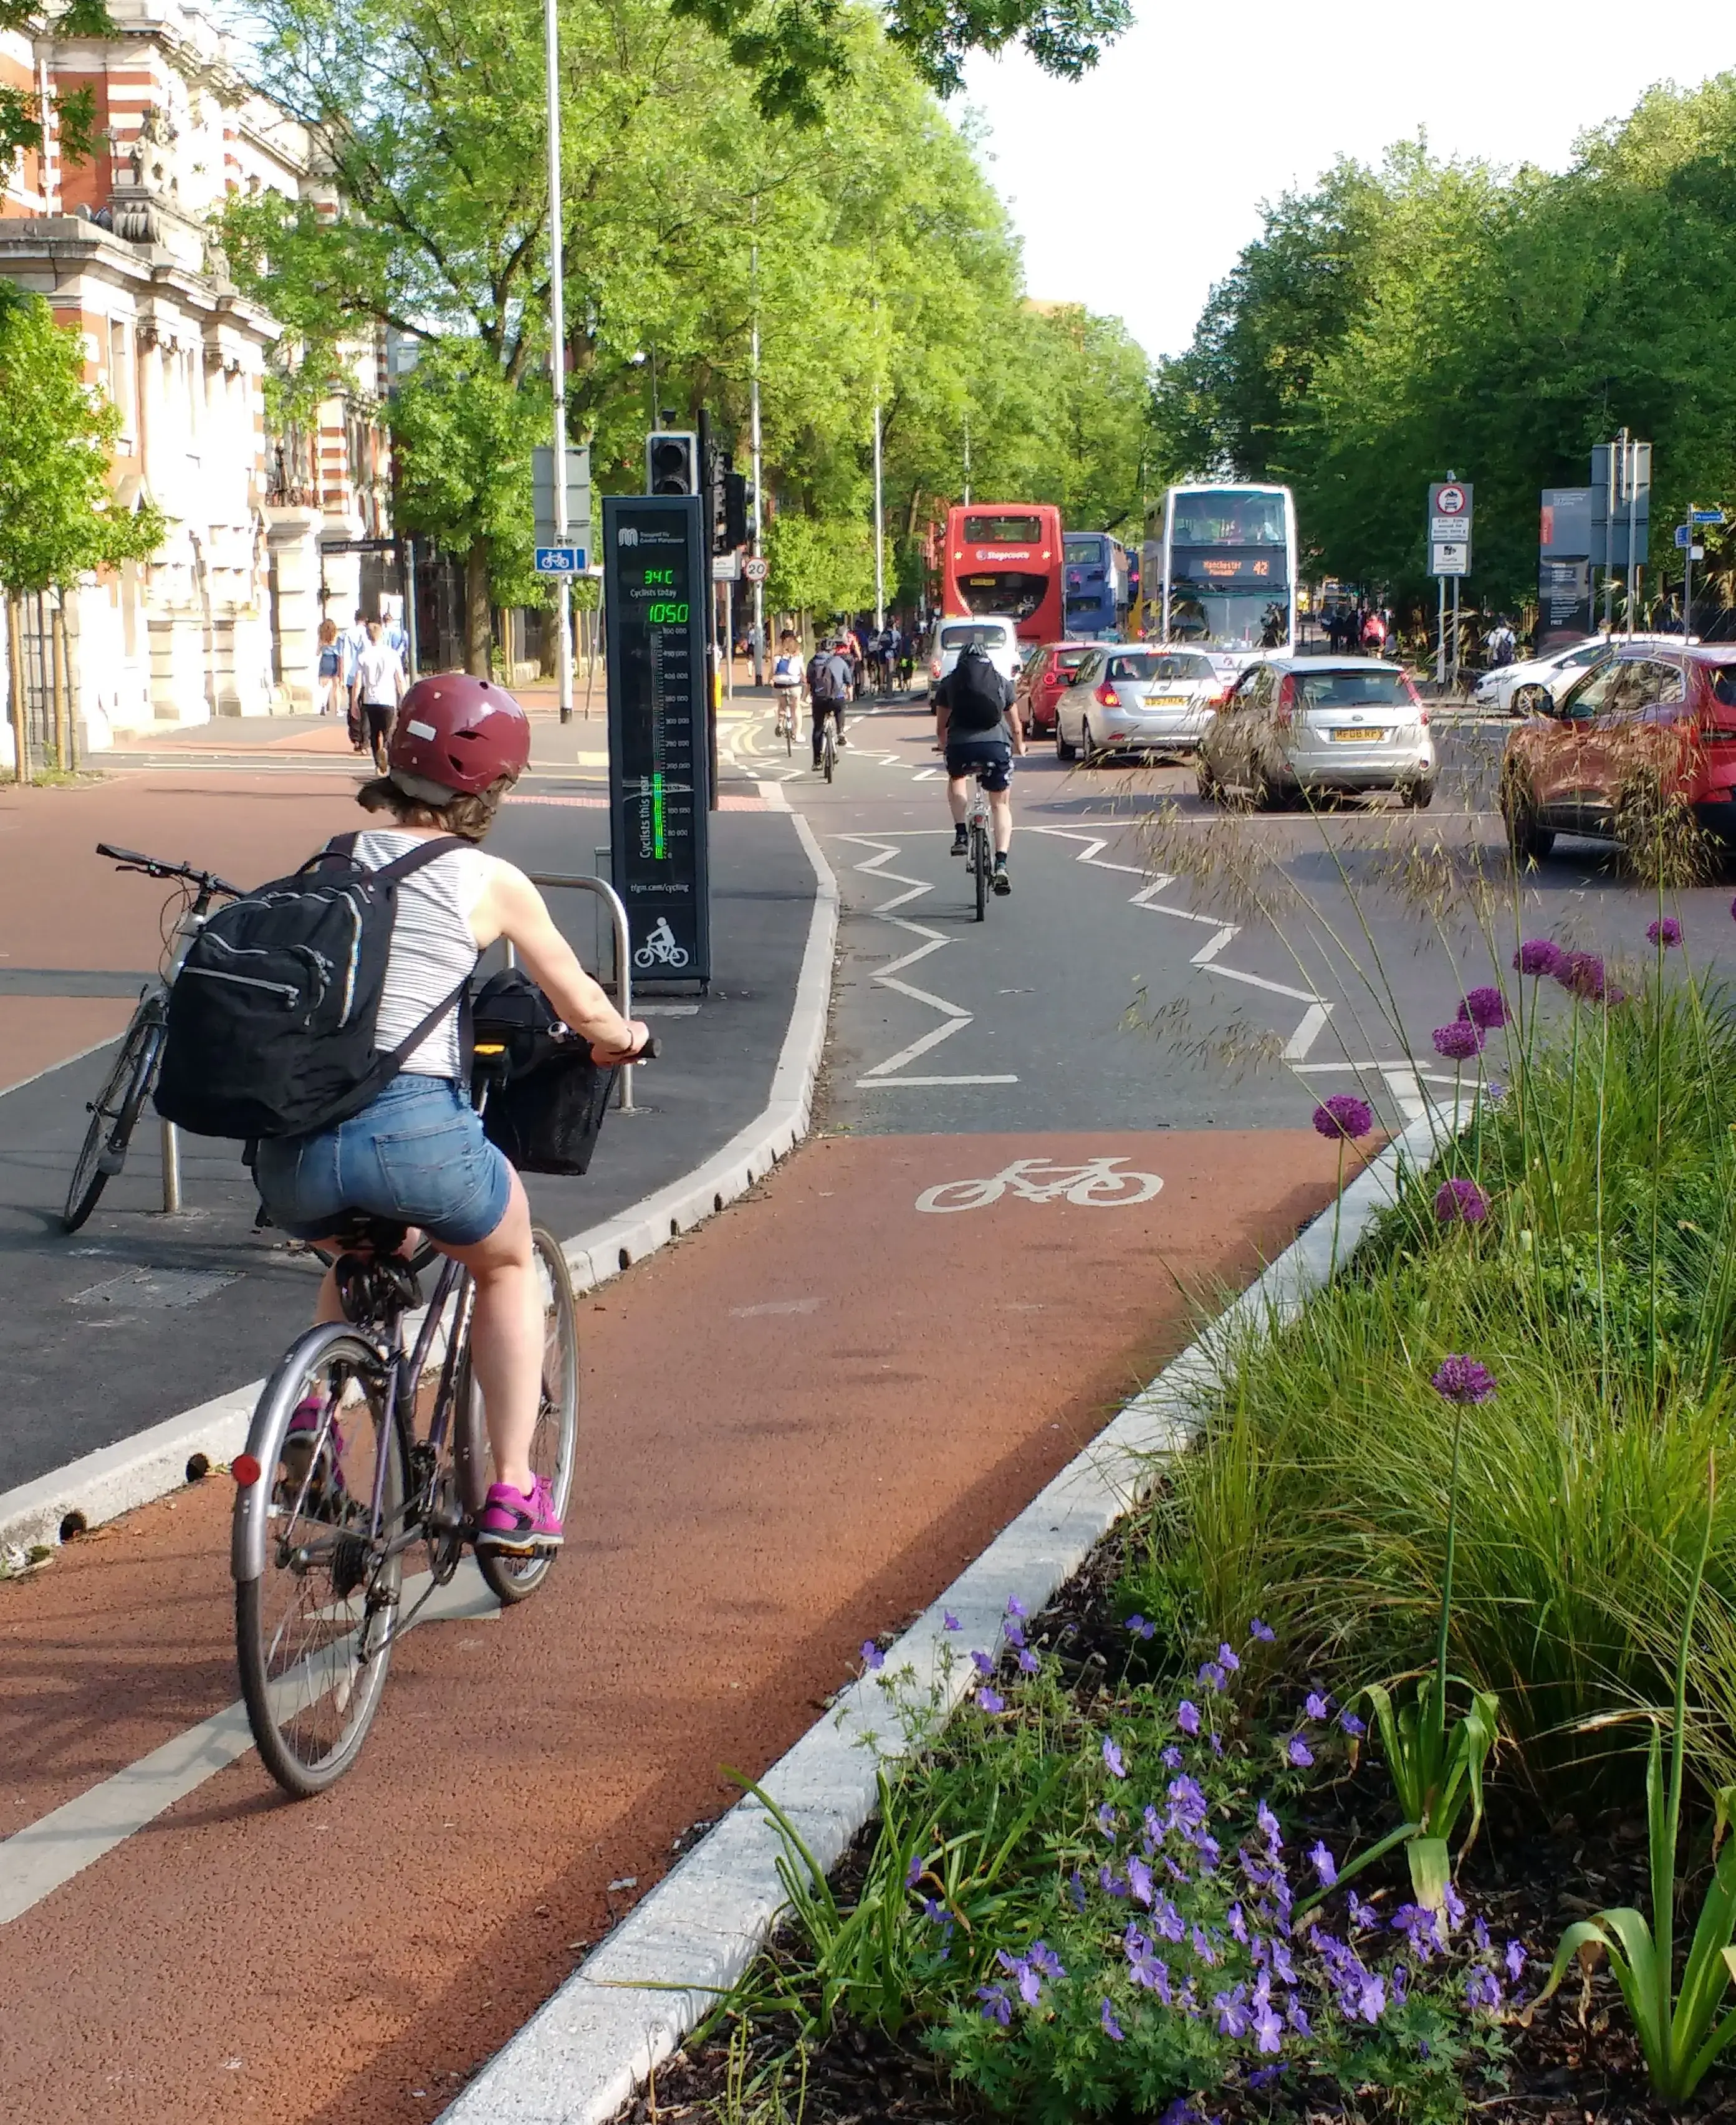
A cycling or pedestrian infrastructure project often represents a significant investment, one that is sometimes contested even before implementation. Measuring usage before and after the work allows for an objective documentation of what has changed: an increase in the number of cyclists, shifts in peak hours, etc. This before-and-after snapshot becomes a key communication tool, both internally to justify the budget allocated and externally to residents and elected officials to demonstrate the project’s relevance.
This is illustrated by the redevelopment of Saint-Denis Street in Montreal, completed in 2020 in just four months. Before the work began, 70% of the street’s space was allocated to motorists (parking and roadways) and 30% to pedestrians and green spaces. Motorized traffic lanes were reduced by half, and the freed-up space was transformed into protected bike lanes, widened sidewalks, and green spaces. After the work was completed, the space allocation shifted to 54% for pedestrians and green spaces, 31% for motorists, and 15% for cyclists.
To objectively assess the project’s impact, Eco-Counter conducted a study on behalf of the City of Montreal by combining data from multiple sources. This included continuous bicycle counts published as open data by the city, as well as a temporary counting campaign conducted in 2018 (prior to the project) using TUBES bicycle counters and PYRO pedestrian counters, validated by manual counts. The data was then extrapolated to annual average daily traffic using seasonal factors derived from comparable roads.
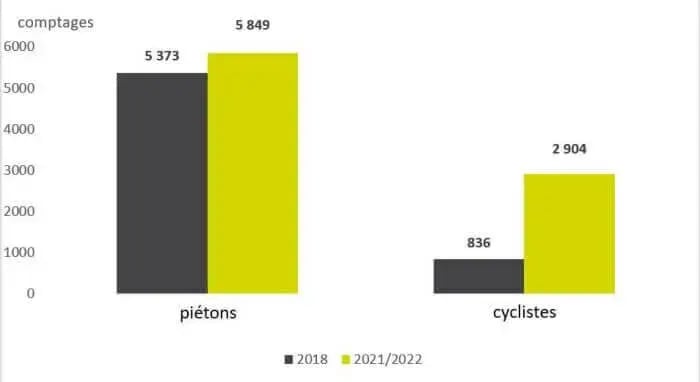
The results of the data analysis, covering the period from 2018 to 2021, are clear: a 9% increase in pedestrian traffic and a 248% increase in bicycle traffic. A closer look at the data even revealed a more nuanced trend: weekday afternoon bicycle traffic increased fivefold compared to 2018, a sign that the route has become safe and pleasant enough for cyclists to choose to use it on their way home. As for motor vehicle traffic, the city observed a 50% decrease in motorized traffic and an average reduction of 8 km/h in vehicle speed .
The study also documented the economic impact of the redevelopment, which is often feared by business owners. The evidence: 37 new businesses opened in 2021, a 65% increase in foot traffic between the summer of 2020 and the summer of 2021, and a retail occupancy rate that rose from 75% in 2019 to 85% in 2023, according to the SDC Rue Saint-Denis. These reliable indicators have made it possible to use factual data to challenge the common misconception that vehicle traffic is the main driver of local commercial activity.
Justifying and saving a project with reliable indicators
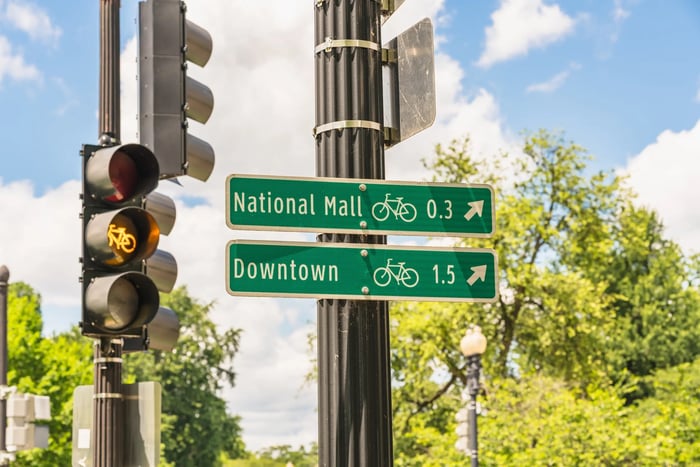
Foot traffic data can also be used to defend a development project that is under threat. This was the case with the protected bike lane on 15th Street in Washington, D.C., which was built in 2021 as part of a Vision Zero initiative and is used daily by nearly 4,000 cyclists. In 2026, plans were considered to partially remove the lane to improve traffic flow. A local cycling advocacy group filed a lawsuit, and a federal judge ultimately decided to suspend the plan to remove the lane, ruling that the available safety and traffic data had not been sufficiently taken into account.
This data, drawn from a report by the District’s Department of Transportation, showed a 91% decrease in bicycle accidents resulting in injuries, a measurable improvement in travel times for all users, and high bicycle usage of the facility. Five years of continuous data collection thus made the difference between keeping the infrastructure in place and removing it: in the face of measured and documented figures, political decision-making no longer has the same room to maneuver.
Better welcoming visitors
In natural areas, visitor count data helps rethink visitor management in the face of overcrowding. This is the case in the Tabular Mountains National Park, in Poland, where 38 PYRO counters installed at entrances and along trails revealed an increase in visitor numbers from 871,000 visits in 2017 to 920,000 in 2019, and revealed that two trails—though very short—alone accounted for 50% of the park’s visits (learn more).
Based on this, a time-slot quota system was implemented, with mandatory reservations. The result: the rate of visitor dissatisfaction due to overcrowding dropped from 53% to 19%, with a more even distribution of visitors both over time and across the park, without reducing the park’s overall appeal (the figures actually showed a slight increase in annual attendance following the implementation of the quotas!).
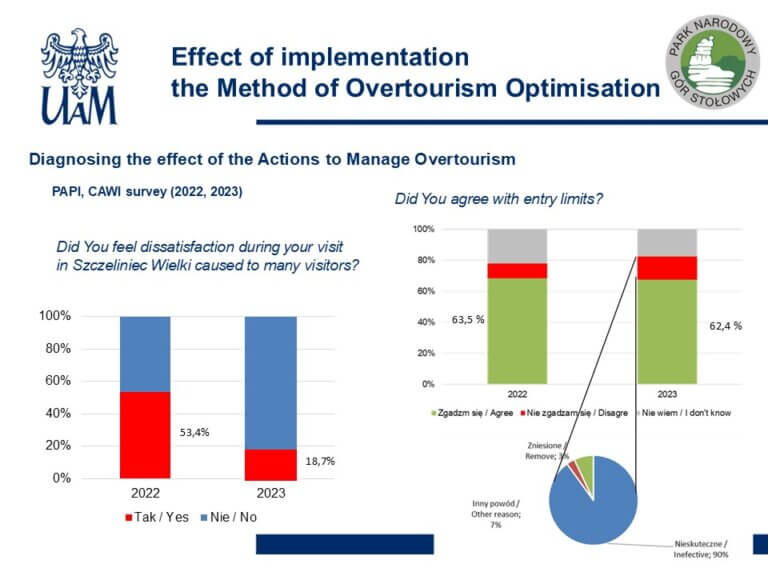
Comparison of visitor satisfaction before and after
the introduction of quotas for visits to the Stołowe Mountains National Park
Forecasting visitor numbers to avoid overcrowding
The final, increasingly central use: forecasting. Collecting data over time now makes it possible to anticipate a site’s visitor numbers for the coming days. This forecasting capability is changing the way teams work: it allows them to communicate with visitors in advance, adjust staffing and logistical resources, and avoid overcrowding that degrades the on-site experience. We’re shifting from reactive management to proactive management.
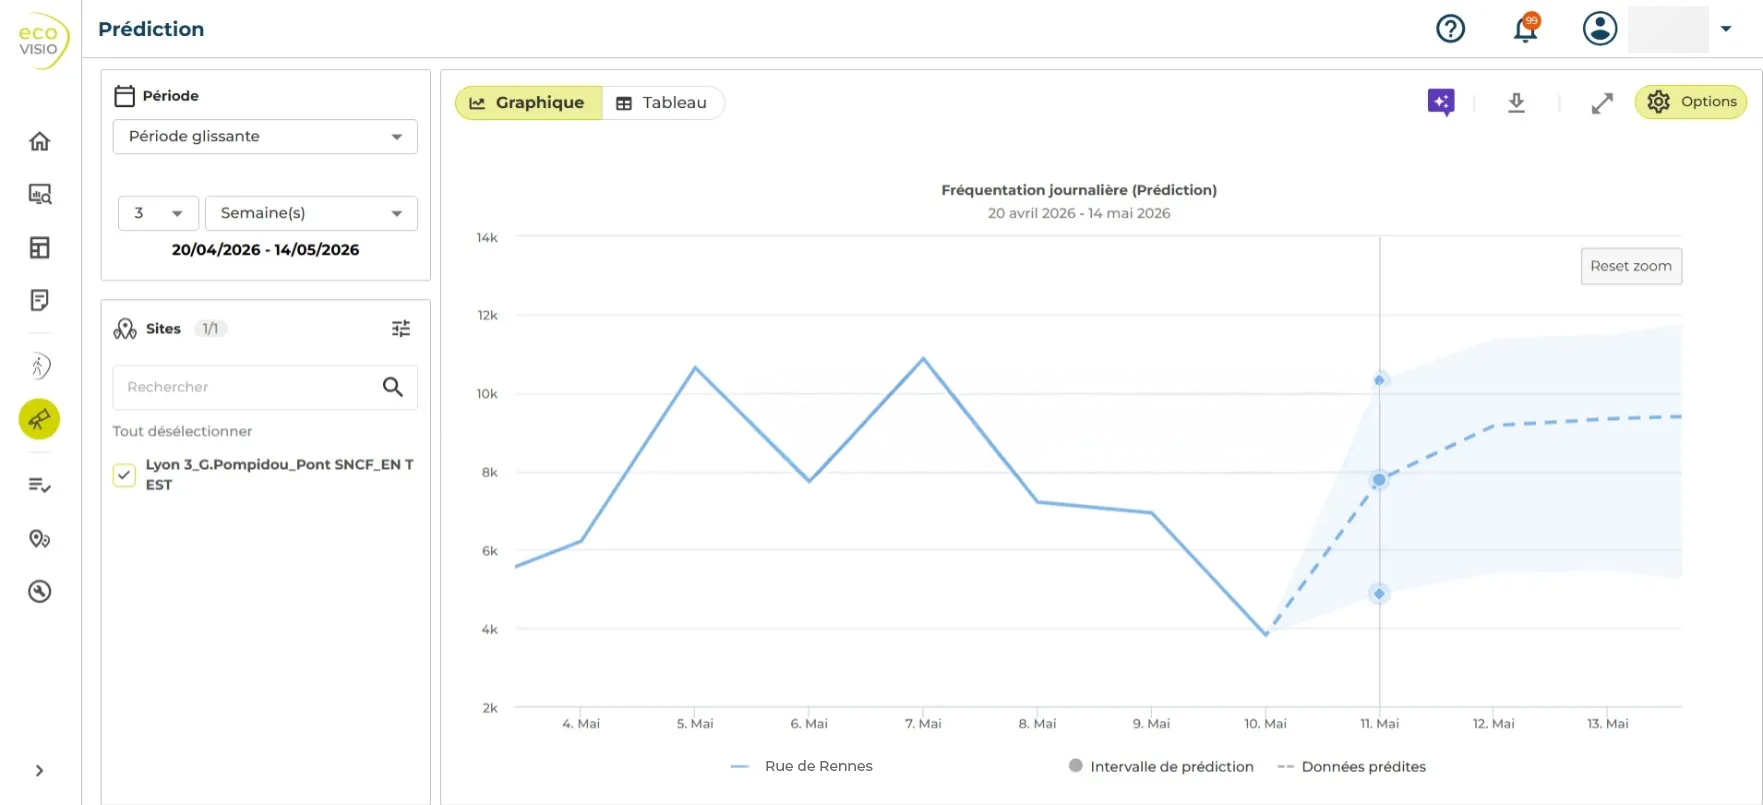 Illustration of visitor traffic forecasting, now available in our Eco-Visio data analytics software
Four uses, four benefits of reliable metrics
| Data Analysis Application | Example | Benefit for Decision-Making |
|---|---|---|
| Measuring before and after | St. Denis Street, Montreal (Canada) | Demonstrate success, secure future budgets |
| Justify a project | 15th Street NW, Washington, D.C. (USA) | Evidence-Based Policy Argument |
| Adapting the visitor experience | Tabulary Mountains National Park (Poland) | Scaling visitor services, better distributing visitor flows |
| Forecasting Visitor Numbers | Visitor Forecasting in Eco-Visio | Proactive communication, resource allocation, preventing overcrowding |
Key takeaways on the importance of data analysis
The value of a counting system is not measured solely by the number of sensors installed, but by its ability to transform the collected data into concrete decisions to promote active mobility or preserve natural and tourist areas. This requires two things: cross-referencing counting data with other relevant sources, and having a platform capable of bringing them together within a single analytical framework. This is precisely the purpose of a tool like Eco-Visio, designed to support teams from data collection through to the interpretation of results.
Whether you need to demonstrate the impact of a development, advocate for a project before elected officials, organize visitor services at a natural site, or prepare for a peak season, our team will work with you to develop the analysis most relevant to your specific context.

FAQ
How can you demonstrate the effectiveness of a cycling or pedestrian infrastructure project? By comparing the measured traffic before and after construction using automatic counters. This before-and-after measurement objectively quantifies the project’s impact and serves as a communication tool for elected officials and residents. It’s the famous “Build it, and they will come!” The example of Rue Rivoli in Paris is THE textbook case: the facility, which was created and gradually expanded, led to a twofold increase in bicycle traffic between 2019 and 2026!
How can you use traffic count data to convince elected officials or funders? By relying on reliable traffic data, potentially cross-referenced with other data sources such as accident statistics (Vision Zero). It was this type of argument that helped save a threatened bike lane on 15th Street in Washington, D.C.
Can you predict traffic at a location in advance? Yes. By analyzing historical data, it’s possible to forecast a site’s traffic for the coming days using predictive models like those available on the Eco-Visio analytics platform. This allows you to allocate resources effectively, avoid overcrowding, and ensure a positive visitor experience. A white paper is available for more details on our methodology, if you are interested, get in touch with us!
What types of data can be cross-referenced with visitor count data? Weather data, traffic data, mobile phone data, geographic information systems (GIS), and qualitative field surveys.
What can a platform like Eco-Visio actually do? It centralizes data from counters and enriches it with data from other sources to produce actionable analyses: weather data, vacation and holiday schedules, qualitative data, and more. The platform also makes it easy to generate reports for sharing data, or to disseminate data to the general public via public web pages or to external sites via APIs.